Topics in Photographic Preservation 2003, Volume 10, Article 12 (pp. 108-125)
Presented at the 2003 Winter Meeting, San Juan, Puerto Rico
Climate control is essential for the long-term preservation of museum and library collection materials. Unfavorable environmental conditions can shorten the life of artifacts and can cost institutions valuable dollars in inefficient energy consumption. Photographic materials in particular are extremely vulnerable to chemical, biological and mechanical deterioration resulting from inadequate storage conditions. By instituting a routine environmental monitoring program incorporating the Climate Notebook™ software, museum staff can be alerted to potential problems, prevent unnecessary deterioration of collection materials through environmental adjustment and avoid the wasting of financial resources.
The Climate Notebook™ software program was designed by the Image Permanence Institute to organize and interpret environmental data obtained from collection storage and display areas. Although hygrothermographs and dataloggers are routinely used to monitor environments, they do not offer quick means for analyzing and manipulating data for making meaningful assessments. Temperature and relative humidity readings from Preservation Environment Monitors (PEMs) and other dataloggers can be electronically imported into Climate Notebook™ to generate graphs and reports from this data, analyze the quality of storage and display areas, and compare climates throughout the museum. This information is useful for conservators, collections managers and engineers who need to make critical decisions regarding environmental conditions. With Climate Notebook™, IPI has introduced two new measurements for estimating the natural aging rate of organic materials (referred to as the Time-Weighted Preservation Index, or TWPI) and the risk of mold growth. The program displays alert warnings when the temperature, RH, aging rate and mold risk reach harmful levels. Additional information on material properties and storage recommendations for long-term preservation of collections is available through the software's materials database. Outdoor weather information for individual cities can also be downloaded from the internet and compared to museum data in Climate Notebook™. This information is useful for evaluating how efficient the institution's mechanical systems are and establishing what indoor environments might be possible given the regional climate.
During the mid-1990s, the Image Permanence Institute began development on a battery operated datalogger known as the Preservation Environment Monitor, or PEM, designed to make environmental monitoring and analysis easier for library, archive and museum use. In 1995, IPI received grant funding from NEH's Division of Preservation and Access to continue research on the Preservation Environment Monitor (PEM) datalogger and to test its potential as a preservation tool. By November 1995, the Commission on Preservation and Access published New Tools For Preservation: Assessing Long-Term Environmental Effects on Library and Archives Collections, which introduced the PEM and the principles behind Preservation Index (PI) and Time-Weighted Preservation Index (TWPI) concepts. Additional grant funding to develop environmental analysis software compatible with the PEM was obtained from the Andrew W. Mellon Foundation in 1997. The software was named Climate Notebook™ because the program uses individual computer files or “notebooks” to store information for each location being monitored. The Image Permanence Institute began accepting applications for participation in the software field trial in 2000, and by November nearly 180 institutions had been accepted. During two-day training sessions, institutions participating in the Field Trial were provided with a copy of the Climate Notebook™ software, two Preservation Environment Monitors, and a SRAM card for downloading the data. Institutions agreed to share data of their collection storage environments with IPI and contribute to the product development.
Climate Notebook™ is a Windows®-based software and thus requires a PC computer with Windows® 95 or greater to operate. A Static Random-Access Memory (SRAM) card is necessary for downloading data from the PEM and importing it into Climate Notebook™. Although external card readers are available for desktop PC's, IPI strongly recommends that users obtain a laptop computer for easier transfer of data from the SRAM card to the computer (Reilly 2002).
Computerized “notebook” files are set up to organize and store data within the Climate Notebook™ program for each location being monitored. Each notebook file contains the location of the datalogger, target temperature and humidity conditions, and a list of what materials are stored in the space. In order to properly assess storage environments, it is important to know what artifacts are in the storage facilities, how they deteriorate mechanically chemically and biologically, and if they are buffered from the environment by protective enclosures.
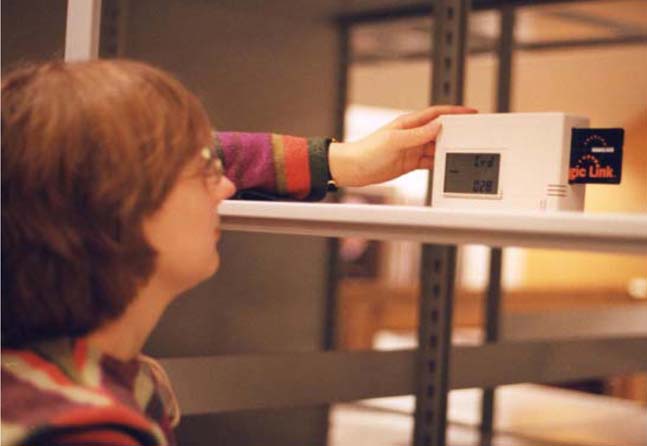
Temperature and relative humidity data can easily be downloaded from the PEM datalogger and copied onto a SRAM Card which acts like a floppy disk (fig. 1). The SRAM card can then be inserted into the PC card reader slot of a laptop computer to electronically import and save data in the designated notebook files.
Fig. 1. Downloading environmental data from the Preservation Environment Monitor onto a “Magic Link” SRAM Card.
It is also possible to import downloaded information from other dataloggers and Excel spreadsheets into Climate Notebook™. The trial version of Climate Notebook™ is programmed to accept data files from PEM, ACR, Spectrum, Pinnacle, Rotronic, Hobo Pro and Trak-R datalogger sources without significant modification on the part of the user. Temperature and relative humidity information from other dataloggers can be converted into a comma separated value file (.csv) in Microsoft® Excel and edited to properly format the data for Climate Notebook™.
Outdoor weather information from the National Oceanic and Atmospheric Administration (NOAA) can also downloaded from the internet into Climate Notebook™. This information is useful for evaluating trends in indoor conditions, establishing how efficient the institution's mechanical systems are and determining what indoor environments might be possible given the regional climate (see Data Analysis sections).
Some information about the properties, recommended storage conditions, environmental alerts and decay limits for photographic materials is available through Climate Notebook's materials database (fig. 2). In order to expand the database, users of Climate Notebook™ have been encouraged to create their own records for materials using the database template and share them with IPI and other Field Trial participants in an online forum.
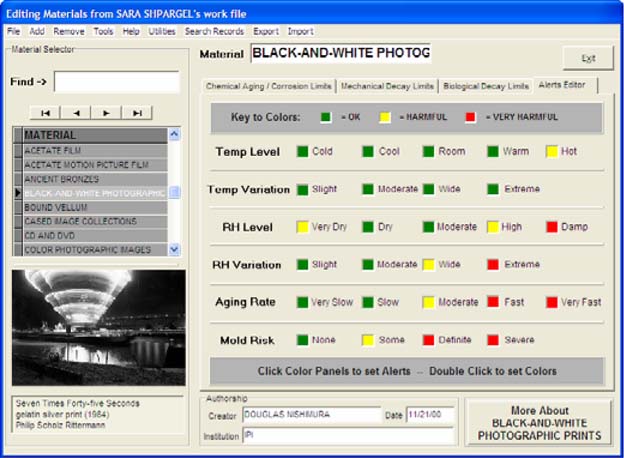
Fig. 2. Detailed view of materials database showing alerts for environmental conditions.
Climate Notebook™ offers four different views for examining data: Collection Manager's View, Engineer's View, Conservator's View and Compare Notebooks View. The Collection Manager's View displays a list of materials that are in each space along with color-coded alert boxes (fig. 3). A green color indicates that the current conditions are acceptable for that particular material, yellow means that conditions may be harmful, and red warns that conditions are very harmful. Specific information about each alert, deterioration characteristics and general recommendations for improvement can be viewed by clicking on each material. For example, black and white photographs may receive a yellow alert if the humidity variation is wide (±35%), putting them at risk for silver image oxidation. To remedy this alert, Climate Notebook™ would recommend lowering the higher humidity levels and reducing them to within ±15%.
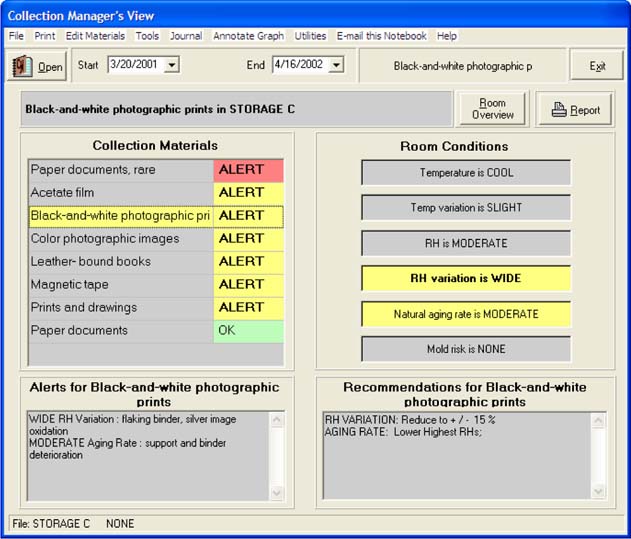
Fig. 3. Example of the Collection Manager's View showing alerts for black-and-white photographic prints.
The Engineer's View show's graphs depicting temperature and relative humidity data, and tracks how often these conditions fall within the set targets for each space (fig. 4).
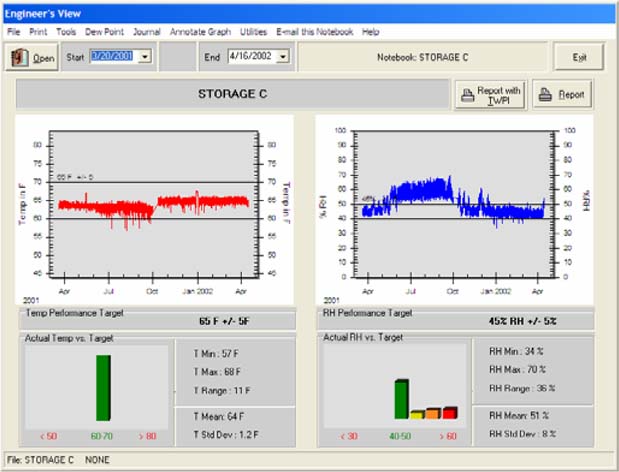
Fig. 4. Example of the Engineer's View showing actual temperature and relative humidity conditions versus target set points.
The Conservator's View provides detailed graphs for temperature, relative humidity, natural aging rate and mold risk. Individual data points, averages, minimum and maximum temperature, relative humidity and Preservation Index conditions can be viewed as well as a list of materials, alerts and deterioration characteristics (fig. 5).
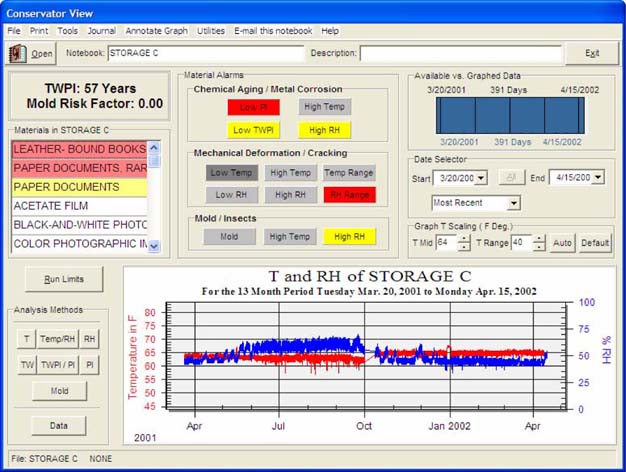
Fig. 5. Example of Conservator's View showing detailed graphs and materials alerts.
The Compare Notebooks View allows environmental data from multiple spaces to be graphed together for side-by-side examination (fig. 6). In addition to comparing temperature and relative humidity conditions, the Compare Notebooks view offers three important tools for data analysis: Time-Weighted Preservation Index (TWPI), Dew Point and Mold Risk Factor. Each of these tools will be discussed in more detail in the sections that follow.
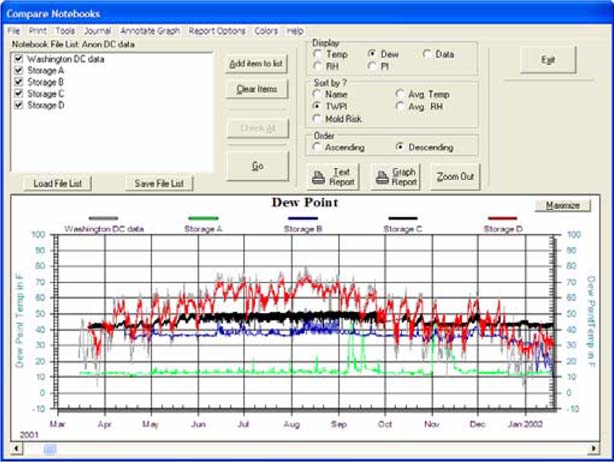
Fig. 6. Example of Compare Notebooks View showing the dew point temperatures for four storage vaults and outdoor Washington, DC.
Time Weighted Preservation Index (TWPI) is a measurement developed by the Image Permanence Institute for estimating the cumulative effects of temperature and relative humidity on the deterioration of organic materials over time. TWPI takes into account that the amount of time materials are kept at warm and damp conditions disproportionately outweighs the time stored at cool, dry conditions. Higher TWPI values mean slower deterioration and longer life for collections. TWPI values around 20–30 years would be expected from spaces without air conditioning while 40–50 years TWPI would be expected from room temperature conditions in which the space has some air conditioning. Likewise, TWPI values closer to 70 years would be expected of cool storage conditions, and TWPI values over 250 years indicate cold storage.
Collection storage areas can be compared by TWPI to determine if the mechanical systems are successfully maintaining environmental conditions that will slow the rate of natural aging. Figure 7 shows sample TWPI data for four storage spaces and outdoor conditions in the Washington, DC area.
Fig. 7. Summary table for Washington, DC storage spaces showing natural aging rate (TWPI).
Storage A, a cold storage vault, has a very high Time-Weighted Preservation Index value of over 270 years, indicating that the rate of natural aging rate for film and photographic materials in these spaces is very slow. Storage Space B has a TWPI of 67 years indicating a moderate, but good aging rate, while materials in Storage C are experiencing a more rapid natural aging rate at 57 years. Prints, photographs and sheet film located in Storage D have the most rapid natural aging rate with a TWPI of 34 years. The fact that the 34 years aging rate for Storage D is actually lower than the 35 years aging rate for the outdoors in Washington indicates that the mechanical systems are not effectively controlling the air supplied to the storage environment and are putting valuable artifacts at risk for chemical deterioration. While it is not recommended that materials in Storage D be relocated outdoors and be subjected to external conditions (i.e. precipitation, sunlight, wind, insects, etc.), the low TWPI values suggest that sufficient improvements in outdoor conditions are not being made before the air is distributed inside.
It should be noted that TWPI values can be occasionally misleading and should not be viewed as the sole factor in evaluating the quality of storage environments. In particular, extremely low humidity values can increase the overall TWPI thereby suggesting that artifacts are well protected by the environmental control system when in fact artifacts may be at risk for severe mechanical damage in the form of cracking, breakage, shrinkage and embrittlement.
The dew point and dry bulb temperature comparison features of Climate NotebookTM allow users to see to what extent indoor spaces are being cooled, heated, dehumidified and humidified. Even though the facilities management may conduct its own monitoring of environments through a building management software program, the centralized computer may not be doing an adequate job of managing air handling. While in theory the building management program does a good job of air handling, in reality the computer program may not accurately record problems associated with the air handling units such as an improperly opened valve, an inappropriately placed sensor or a thermostat in need of calibration. The facilities operator may also not completely understand how the mechanical system works and may overlook potential problems or make adjustments to temperature and relative humidity set points without considering correlating affects on collections preservation. With the dew point feature, the extent of institutional environmental control becomes transparent regardless of what the building computer or museum staff claim is being done.
By comparing indoor and outdoor dew points, one can determine if the mechanical systems are successful in dehumidifying air during the summer and humidifying during the winter. Figures 8, 9 and 12 show the dew point temperatures for Storage B, Storage C and Storage D in comparison with outdoor Washington. Storage B, which has the best TWPI of these 3 spaces, is successful in actively controlling humidity by maintaining the lowest dew point around 40°F during the summer through air conditioning (fig. 8).
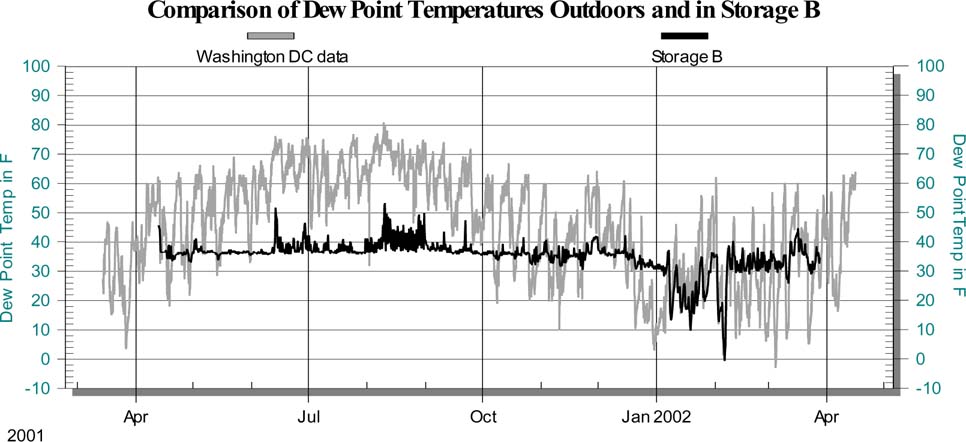
Fig. 8. Comparison of dew point temperatures outdoors and inside Storage B illustrating the low indoor dew point temperature achieved year-round.
It appears that Storage C also maintained a dew point close to 40°F during the spring and an institutional change was made to raise the dew point temperature to 50°F before the onset of summer (fig. 9). This change has caused a significant 10% increase in relative humidity and lowered the natural aging rate for artifacts (fig. 10–11).
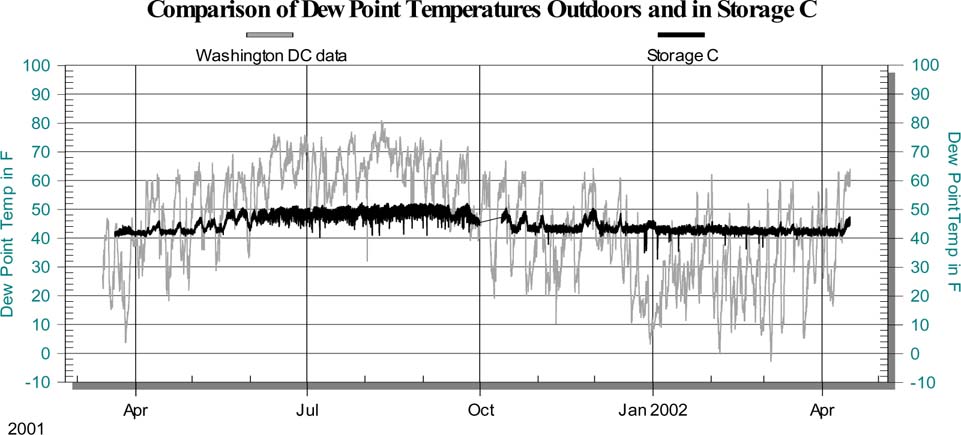
Fig. 9. Comparison of dew point temperatures outdoors and inside Storage C showing an increase in the indoor dew point temperature achieved from June through October.
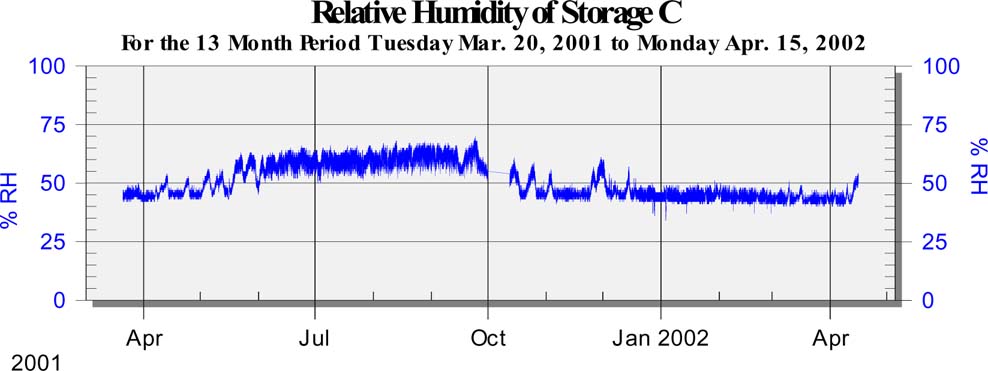
Fig. 10. Relative humidity graph for Storage C depicting a 10% increase from June to October.
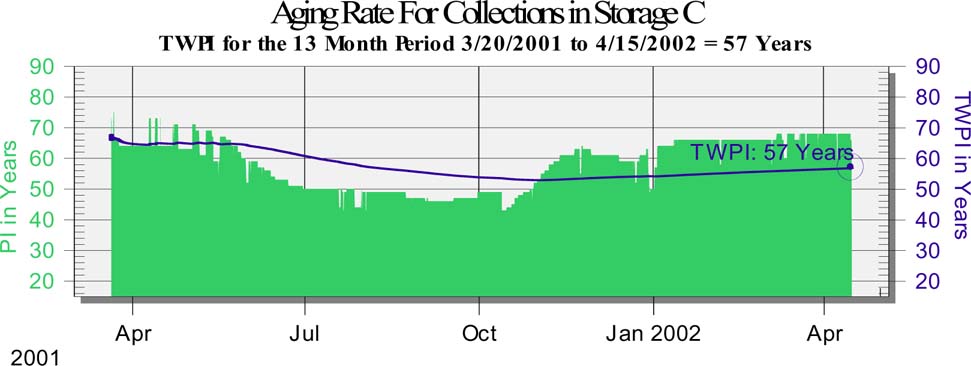
Fig. 11. Graph depicting the natural aging rate (TWPI) for collections in Storage C showing a faster aging rate during the summer months of June through October.
The mechanical systems for Storage D do not appear to be controlling the summer dew point temperature through air conditioning like Storage B and C because the dew point readily fluctuates between 35°F and 65°F following the dew point line of the outdoors (fig. 12).
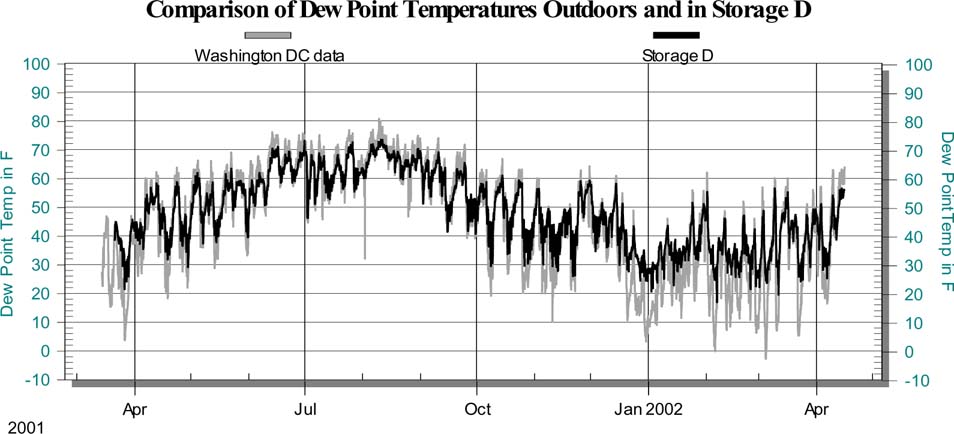
Fig. 12. Comparison of dew point temperatures outdoors and inside Storage D showing little improvement in the indoor dew point temperature achieved from June through October.
Since outdoor air for Washington is generally cold during the winter months, it is possible to heat the cold supply air to a desired temperature for indoor distribution and then humidify the air to achieve desired relative humidity set points. This change in humidity is reflected as an increase in indoor dew point temperatures over the outdoor dew point temperatures when both are examined using the Compare Notebooks View (fig. 13). Note that Storage C shown in fig. 13 is being humidified during winter months because the indoor dew point temperatures are much higher than the outdoor dew point temperatures.
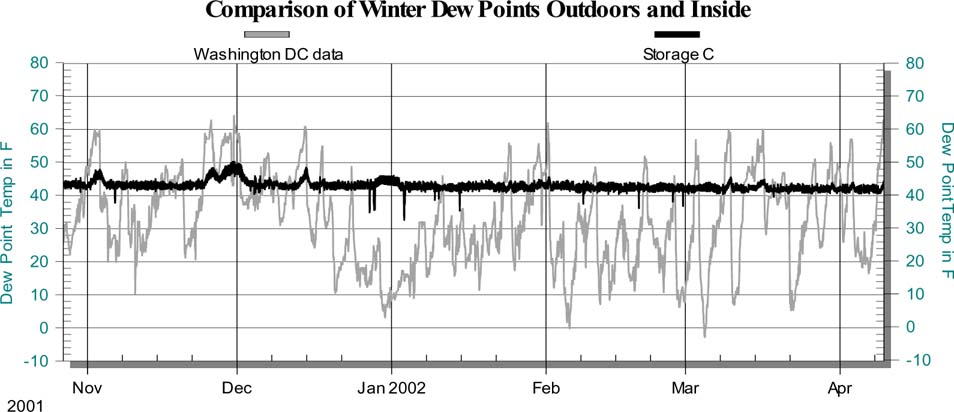
Fig. 13. Comparison graph of winter dew point temperatures for outdoor Washington and inside Storage C. Higher indoor dew point temperatures indicate that the outdoor air is being humidified before it is distributed inside.
By examining a combination of dew point and dry bulb temperature graphs, Climate Notebook™ users can also track the heating and cooling of their monitored spaces. figure 9 shows the comparison of dew point temperatures outdoors and inside Storage C. During the months of July through October it is evident that the 60°F - 70°F dew point temperature of the outdoor air has been dried to yield a 50°F dew point temperature inside Storage C. The dry bulb temperature comparison graph (fig. 14) confirms that the temperature inside Storage C is cooler than outdoors from July to October and indicates that after air conditioning to produce a 50°F dew point temperature, the air was reheated to approximately 64°F. This dry bulb temperature comparison graph also reveals that from November to April the supply air was heated to maintain 65°F inside Storage C.
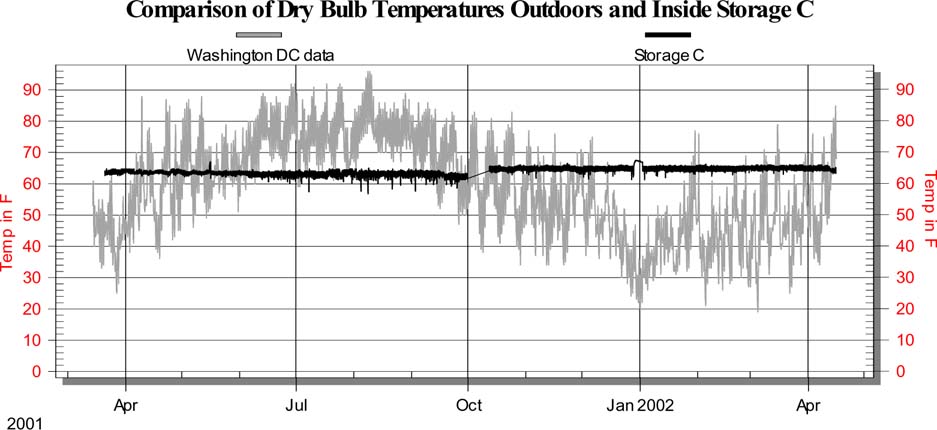
Fig. 14. Comparison graph of dry bulb temperatures for outdoor Washington and inside Storage C. Air is being cooled and reheated to approximately 64°F during the summer, and heated to the same set point during the winter.
It is expected that museum administrators and facilities managers select environmental control set points for their institutions that will best preserve collection materials. However, satisfying human comfort levels and reducing operational costs within the institution often take precedence over preservation concerns. Arriving at a balance between object and human comfort levels is more difficult than one might think. Often several mechanical systems are operating within the institution to provide different climate zones. Each mechanical system will have its own air handling unit with separate controls for temperature and relative humidity, but may supply the air to multiple rooms. Using the compare dew points feature, it is possible to determine if any of the monitored spaces share the same air handling unit. When spaces share an air handling unit, the graphs of their dew point temperatures will overlap perfectly. One should be aware that storage and gallery spaces may also share air handling units with public hallway and office spaces, and that making any changes in temperature or relative humidity set points could directly affect all spaces shared by the air handling unit.
The dew point comparison feature can also be useful in predicting if condensation will occur on an object if it is moved from a colder storage space to a warmer environment. Condensation will occur if the temperature of the object is at or below the dew point temperature of the new environment. For example, if a reel of acetate motion picture film kept at 40°F was removed from its cold storage vault and relocated to an inspection room where the dew point temperature is 50°F, one could expect to see condensation form. It should be noted that Climate Notebook™ does not currently provide an alert to warn users of condensation formation, nor can it calculate the rate at which an object will absorb the moisture of its environment.
The temperature and relative humidity data can also be used to estimate if biological decay is probable within the museum. Climate Notebook™ uses this data to calculate the Mold Risk Factor, an algorithm which numerically expresses the likelihood and severity of a mold outbreak. The technical basis for the Mold Risk Factor was derived from several published research studies (including Pitt 1993; Snow et al. 1944; Michalski, 1993; Ayerst 1969; Cory 1997) regarding the effects of environmental conditions on the germination and growth of mold on food grains and organic materials. Calculations for the Mold Risk Factor assume that in order for mold spores to germinate, the relative humidity must be at least 65% and the temperature generally within the range of 36°F −113°F (Nishimura 2003; Image Permanence Institute 2002). The amount of time conditions remain warm and damp will directly impact Mold Risk Factor values. One should keep in mind that other factors such as air movement, dirt and localized moisture accumulation will also affect mold growth, but are not accounted for in the Mold Risk Factor calculation. A Mold Risk Factor of zero indicates that there should be no possibility of mold germination. Conditions become more favorable for germination as the value increases up to 1. An active mold outbreak is likely with a Mold Risk Factor between 1 and 3, and potential damage to collection materials increases as the Mold Risk Factor becomes greater than 3.
Examination of various outdoor climates helps to put Mold Risk Factor values into perspective. For example, an average yearly Mold Risk Factor of 0.3 would be characteristic of relatively dry outdoor conditions in the Nevada desert, a Mold Risk Factor of 17 might be characteristic for the mid-western state of Missouri, and a rather tropical area such as Guam might have an outdoor Mold Risk Factor of 70 or higher. For areas where mold is favorable, it is often difficult for air conditioning systems to overcome the humid outdoor climate. Whenever possible, institutions should strive to maintain relative humidity levels under 55% during humid months to prevent a mold outbreak. This may involve reheating chilled air to warmer temperatures in order to lower the relative humidity. While increasing the indoor air temperature would increase the natural aging rate for collection materials, a potential mold problem should be viewed as a more serious threat to collections and remedied immediately (Reilly 2002).
The outdoor climate of Washington, DC was found to have a Mold Risk Factor of 5.32 based on yearly data derived from a local NOAA weather station. Because the outdoor Mold Risk Factor for Washington is favorable but low, an air conditioning system should be able to draw enough moisture out of the air during humid months to alleviate mold risk indoors. However, collection materials be examined closely for a potential mold outbreak if conditions remain warm and damp for extended periods of time.
Once evidence of environmental conditions is obtained, the current mechanical systems can be examined to determine if improvements can be made. Examples of common cooling systems include desiccant dehumidification systems to maintain low humidity storage at cold temperatures, direct expansion units which cycle cold air like a refrigerator and chilled water systems of air conditioning (Reilly 2002). It is important to have some understanding of how these different mechanical systems operate in order to determine if they are capable of achieving better conditions. For example, chilled water systems are not capable of cooling to a dew point much lower than 40°F because water will freeze the cooling coil around 32°F. In order to achieve colder dew points, mechanical systems must have desiccants to absorb more moisture from the air and may require a different coolant than water. Therefore when making recommendations for cooler and drier set points, one should keep in mind that chilled water systems can at best cool the air to a 40°F dew point (Reilly 2002).
It is generally assumed that most archival materials are best preserved when stored between 30–50% relative humidity. A psychrometric calculator available via the internet can be used to determine how warm the chilled air must be reheated to achieve this relative humidity range in the non-cold storage spaces (Linric 2002). The psychrometric calculator calculates dry bulb temperatures when the values for the dew point and relative humidity variables are given. Figure 15 shows the dry bulb reheat temperatures necessary to achieve 30 - 50% relative humidity for air with dew points between 40°F −50°F.
Fig. 15. Summary table of dry bulb temperatures required to maintain 30–50% relative humidity at 40–50°F dew point temperature conditions.
It is estimated that with a 40°F dew point, the air would need to be reheated to 59 - 73°F to maintain a relative humidity between 30 and 50%. This is a significant improvement over the 50°F dew point, for which air must be reheated to between 69 and 85°F to achieve the same RH range.
To achieve the best possible environment for air conditioned spaces, institutions should attempt to lower the dew point temperature to as close to 40°F as possible through air conditioning and then reheat less to keep temperatures between 55°F and 68° to ensure that the relative humidity does not exceed 55% in the summer. The goal of these suggestions is to raise the TWPI of the storage areas and thus slow down the rate of natural aging for the collections. While lowering the dew point temperatures would result in higher chilled water consumption and raised operating costs, institutions can offset some of these costs by reducing the amount of heating year-round and humidifying slightly less during the winter. In addition to being cost-effective, maintaining colder temperatures and lower humidity levels at 35% - 45% relative humidity during winter months will help increase the natural aging rate of collection materials. A slow transition between different seasonal conditions should not pose a threat of mechanical or physical damage to collection materials (Reilly 2002).
Acetate film, nitrate film and color photographic materials require cold storage to significantly slow their rate of deterioration. Warmer environmental conditions put these color materials at risk for dye fading or shifting of color, gelatin softening, and distortion of the binder and structural support. Color photographic and film materials on acetate base film supports are also susceptible to vinegar syndrome if stored at room temperature.
In addition to color materials, some of the earliest and most important monochromatic photographs will also benefit from cold storage. Institutions can implement cold storage conditions for collection materials by constructing a cold storage vault or purchasing commercial freezers. Photographic materials going into cold storage should be properly boxed and enclosed in impermeable sealed bags to protect against condensation formation.
Occasionally collection storage areas are incapable of achieving adequate environmental conditions with the current mechanical systems in place. While inadequate conditions may be acceptable for temporary storage situations, institutions should consider relocating collection materials to cooler, more controlled storage vaults if these mechanical systems cannot be upgraded or replaced.
The Climate Notebook™ appears to be a major improvement in environmental monitoring technology. Having used Climate Notebook™ this past year, it is the author's observation that the repetitiveness of tasks develops skills that make the software easy to operate and time efficient for the conservator. The software's help menu acts as a complete operator's manual, providing term definitions, general information about the program and step-by-step directions. The Climate Notebook™ website and Image Permanence Institute staff also provide exceptional technical support.
A major advantage of the program is its compatibility with many commonly used dataloggers, so that institutions that already own dataloggers do not need to purchase entirely new equipment to operate Climate Notebook™. Compared to hygrothermographs and other datalogging systems, Climate Notebook™ offers more useful information about environments such as dew point, natural aging rate and potential mold risk. A general foundation of preservation knowledge including deterioration characteristics and recommended storage practices for specific collection materials is also provided through the software's materials database. This information is most beneficial for institutional staff who might not have conservation experience and need to make informed decisions regarding collection environments.
The data, target set points and materials alerts can be easily edited and manipulated in Climate Notebook™ to serve the needs of the institution. The program also has the ability to generate reports in a variety of formats for distribution of data. Different report formats allow users to select information that is best suited for particular audiences which might include conservators, collections managers, engineers, administrators, trustees or the general public.
Despite its demonstrated potential as a preservation tool, the software does leave way for further improvements and advancement in the areas of environmental analysis and monitoring for cultural institutions. Due to the current design of the software, the program is not able to selectively calculate TWPI for a specific period of time within the notebook data. This makes it difficult to accurately compare a space that has been monitored for an entire year with a space monitored for less time. The program also does not take into account air movement, pollutants, exposure to light and UV radiation, and moisture equilibration which can affect the rate of deterioration and mold growth.
While the materials database is informative, many of the records are incomplete and could be expanded. In addition, several materials commonly found in museums and archives have not yet been included in the database.
It would be beneficial to have a feature or view in Climate Notebook™ that summarizes which materials are most vulnerable to changes in temperature and relative humidity. Furthermore, the Field Trial versions of the software do not offer any tools for calculating moisture equilibration of artifacts. Without such a feature, it is impossible to estimate how long it will take an object to absorb the moisture of its environment and how much variation in humidity the object can withstand. To date, IPI has been reluctant to include a moisture equilibration tool in Climate Notebook™ due to the complexity and variability of the calculations involved. Specific factors such as the material composition of the artifact and the manner in which it is packaged for storage will affect the equilibration rate and need to be accounted for in the calculations (Nishimura 2003).
Climate Notebook™ also does not offer any features to help users determine what environment is possible given their current mechanical systems, nor does it mention the operation of HVAC systems and their role in environmental management. A feature that simulates how the environment might react to specific adjustments in temperature, relative humidity and dew point set points would be very practical for those making environmental decisions. Without some prior knowledge of mechanical systems and data analysis, it is difficult for users to make confident assessments of the environment. Future versions of the software could also provide some guidance for applying the data once it has been collected and analyzed.
While the preservation assistance provided by Climate Notebook™ is valuable for all institutions, the proposed cost of purchasing a system of Preservation Environment Monitors and Climate Notebook™ software might make it impractical for institutions with limited budgets. Unfortunately, it is often these smaller institutions that would benefit the most from having such a monitoring system to assist staff in managing preservation of their collections. In order to gain acceptance and create a demand for Climate Notebook™ amongst the majority of collecting institutions, the Image Permanence Institute will need to ensure that it is made affordable for all institutions.
The author wishes to thank the faculty and fellows of the Advanced Residency Program in Photograph Conservation; especially James Reilly, Grant Romer, Gary Albright and Mark Osterman for their guidance and contributions to this project. Doug Nishimura, Edward Zinn, Elizabeth Goins, Kim Sennett and the staff of the Image Permanence Institute have assisted with environmental analysis and provided technical support for Climate Notebook™. This study would also not be possible without the generous support of the Andrew W. Mellon Foundation and the Advanced Residency Program in Photograph Conservation.
Appelbaum, B. 1991. Guide to Environmental Protection of Collections, Madison, CT: Sound View Press.
Arenstein, R. P. 2001. Comparison of Temperature and Relative Humidity Dataloggers for Museum Monitoring. AIC News. January: 16–19.
Ayerst, G. 1969. The Effects of Moisture and Temperature on Growth and Spore Germination in Some Fungi. J. Stored Prod. Res. 5: 127–141.
Cassar, M. 1997. Environmental Management Guidelines for Museums and Galleries, Museums and Galleries Commission, London and New York: Routledge.
Cassar, M. 1994. Museums Environment Energy, Museums and Galleries Commission, London: HSMO.
Chicora Foundation, Inc. 1994. Managing the Museum Environment. Climate Notebook™ website. www.climatenotebook.org (accessed 2002–2003).
Corry, J.E.L. 1987. Relationships of Water Activity to Fungal Growth. Chapter 2 in Food and Beverage and Beverage Mycology, 2nd ed., ed. L. R. Beuchat. New York: Van Nostrand Reinhold Mycolo Company, Inc. 58–99.
Herzog, P. 1997. Energy-Efficient Operation of Commercial Buildings Redefining the Energy Manager's Job, New York: McGraw-Hill.
Image Permanence Institute. 2000. Preservation Environment Monitor Operator's Manual. Rochester, NY: Image Permanence Institute, Rochester Institute of Technology.
Image Permanence Institute. 2001. Climate Notebook™ User's Manual, Edition 2.4. Rochester, NY: Image Permanence Institute, Rochester Institute of Technology.
Image Permanence Institute, 2002. Climate Notebook™ Help. Climate Notebook™ Environmental Analysis Software for Libraries, Archives and Museums, Field Trial beta version 2.5. Linric Company website. www.linric.com/webpsy.htm (accessed February 2003).
Michalski, S. 1993. Relative Humidity in Museums, Galleries and Archives: Specification and Control. In Bugs, Mold and Rot II: Workshop Proceedings of the Moisture Control Workshop. Washington, DC: National Institute of Building Sciences. 51–62.
Nishimura, D. 2003. Personal Communication. Image Permanence Institute, Rochester Institute of Technology, Rochester, NY.
Pitt, R.E. 1993. A Descriptive Model of Mold Growth and Aflatoxin Formation as Affected by Environmental Conditions. Journal of Food Protection. 56: 139–146.
Reilly, J., D. Nishimura, and E. Zinn. 1995. New Tools for Preservation Assessing Long-Term Environmental Effects on Library and Archives Collections, Washington, DC: The Commission on Preservation and Access.
Reilly, J. 1993. IPI Storage Guide for Acetate Film, Rochester, NY: Image Permanence Institute, 1993.
Reilly, J. 1998. Storage Guide for Color Photographic Materials, Albany, NY: The University of the State of New York.
Reilly, J. 2002. Personal Communication. Image Permanence Institute, Rochester Institute of Technology, Rochester, NY.
Rose, W. 1994. Effects of Climate Control on the Museum Building Envelope. Journal of the American Institute for Conservation 33: 199–210.
Snow, D., M. H. G. Crichton, and N. C. Wright. 1944. Mould deterioration of feeding-stuffs in relation to humidity and storage: Part I. the growth of moulds at low humidities. Annuals of Applied Biology. 31: 102–110.
Snow, D., M. H. G. Crichton, and N. C. Wright. 1944. Mould deterioration of feeding-stuffs in relation to humidity and storage: Part II. the water uptake of feeding-stuffs at different humidities. Annuals of Applied Biology. 31: 111–116.
Papers Presented in Topics in Photographic Preservation, Volume 10 have not undergone a formal process of peer review.