Topics in Photographic Preservation 2009, Volume 13, Article 19 (pp. 128-136)
Presented at the 2009 PMG Winter Meeting in Tucson, Arizona
Abstract – The Metropolitan Museum of Art has in its collections an important group of Autochrome plates that have been surveyed and documented in digital image-based condition reports using Adobe Acrobat©. It is this collection that provided the context for an investigation of the effectiveness of anoxic environments in delaying the fading of dyes used in the Autochrome process – Tartrazine, Erythrosine B, Rose Bengal, Patent Blue, Crystal Violet, and Malachite Green Orthochlorinated. The dyes were subjected to accelerated light fading in both an atmospheric and an anoxic environment (argon gas with oxygen scavengers). Significant increases in color stability were observed under anoxic conditions, though fading was not completely arrested. A preliminary microfading test was also explored. The sensitivity of Autochrome dyes to light was confirmed: exposure for approximately 8 Mlux-hrs in a standard oxygen environment resulted in visual changes perceptible to an average viewer.
The Autochrome was the first commercially viable color photographic process. Introduced by the Lumière brothers in 1907, it remained in production until 1935. The Autochrome was a reversal process that produced one unique image – a positive transparency on a glass support, meant to be viewed by projection or against a light source.
Because of the risk of fading of the color screen layer, the majority of museums and collections now have a policy of not displaying original Autochromes. However, the literature on dye stability has suggested that oxygen is often a critical element in the fading reaction (Arney et al. 1979). This investigation therefore set out to explore the application of anoxic environments to the display of Autochromes.
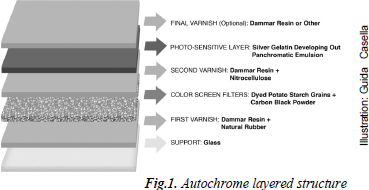
In the Autochrome process, a glass support was covered with a layer of varnish composed of dammar resin and natural rubber dissolved in toluene. This varnish layer remained sticky, adhering the color screen layer, composed of evenly mixed potato starch grains individually dyed orange-red, green and violet-blue. Fine black carbon powder was used to fill remaining gaps between the grains and the layers were then pressed flat in a rolling press. A second varnish composed of nitrocellulose, castor oil, and dammar resin was applied to protect the starch grains from moisture, followed by a panchromatic silver gelatin emulsion, which constituted the light sensitive layer. After exposure in a camera and processing, photographers often coated the image with a further layer of varnish - commonly dammar resin, although other varnishes were also applied (cf. Passafiume 2005).
Fig. 1. Autochrome layered structure
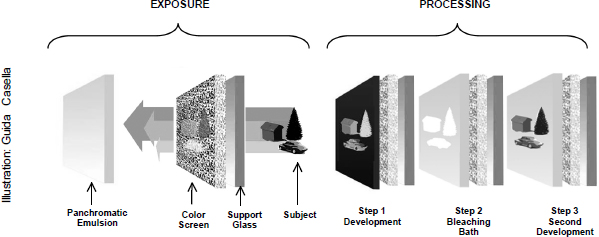
Fig. 2. Exposure and processing steps
The Autochrome plate was exposed in the camera with the color screen layer facing the subject (fig.2). Light reflected from this subject therefore reached the photo-sensitive silver gelatin emulsion only after passing through the red, green and blue potato-starch filters. Thus, for example, red colored light reflected from the subject would preferentially pass through the red grains affecting the sensitive emulsion in that area, but would be blocked by the green or blue grains.
During the first development, the areas affected by light were reduced to dark metallic silver, resulting in a black and white negative image. At this point, the remaining photo-sensitive silver halides – which had not been affected by light – were still present in the silver gelatin layer. A bleaching solution then removed the black, developed metallic silver, leaving only the still photosensitive silver halides that had not been exposed initially. Next, the plate was exposed to light, affecting the remaining silver salts, and developed a second time. When the resulting black and white positive transparency was viewed in transmitted light, the minute color filters embedded in the color screen produced the effect of a positive image with natural color.1 Finally, the plates were commonly bound against a cover glass, using a paper tape with a heat activated adhesive.
The Department of Photographs of The Metropolitan Museum of Art in New York has in its collections forty Autochrome plates, primarily by early twentieth-century Pictorialist photographers. Alfred Stieglitz and Edward Steichen, two key figures in the Pictorialist movement, had been present when the Autochrome process was made public by the Lumière brothers in Paris. They then played a pivotal role in the introduction of the process in the United States. The Autochrome process was, however, used by Stieglitz and Steichen’s circle for only a short time in the years following 1907 (Hammond 1994) and this has enhanced the rarity and importance of the images in the Metropolitan Museum’s collection. The Museum has, in addition, two plates in the Department of Arts of Africa, Oceania and the Americas by Fred Payne Clatworthy and Franklin Price Knott - two photographers known for their contributions to The National Geographic Magazine - and a group of fifty plates belonging to the Egyptian Department, taken by Harry Burton to document a Metropolitan Museum of Art archaeological expedition to Egypt in the 1920s.
The plates belonging to the Department of Photographs have been surveyed and photographed and individual digital condition reports have been created using Adobe Acrobat©. Documenting the condition of objects represents a vital aspect of any conservator’s responsibilities. The importance such documentation cannot be overstated, in recording the condition of objects and enabling any changes to be monitored over time. Condition reports are most commonly entered on the Museum’s database, The Museum System© (TMS).2 The conservation form has several fields, though condition reports are, for the most part, entered as free text in the ‘Remarks’ field. Since the location of any damage is difficult to describe accurately in a text format, condition reports are frequently accompanied by a hand-annotated hardcopy of the image.
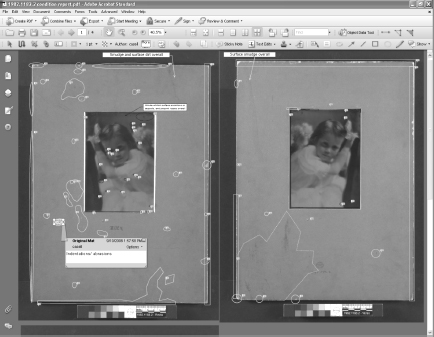
More recently, Adobe Acrobat Standard 8© has been used to generate digital condition reports including images annotated with commenting tools. High quality digital images were taken for these reports by the Museum’s Photography Studio, saved in PDF format, and combined, using Adobe Acrobat©, in a single document containing multiple views and details of the object. This method offers several advantages: files can be opened using free software (Adobe Reader©); documents can include multiple views of the object; digital condition reports can be attached to TMS, e-mailed or printed; and the same document can be used for condition reporting over time. The report is saved on a shared drive that is regularly backed up. In addition, a copy that has no interactive features is saved and linked to TMS. This second copy is electronically more stable in the long-term and has a lower file size than the original report.
Fig. 3. Example of annotated condition report made with Adobe Acrobat© (seen here plate MMA#1982.1183.2)
Autochrome plates are generally considered “extraordinarily light-sensitive” (Wagner et al. 2001), so facsimiles are usually put on display in place of originals. Past research (Krause 1985; Lavédrine and Gandolfo 1993) has demonstrated that Autochrome plates are very sensitive to moisture and heat as well as light. Light will cause the dyes in the color screen layer to fade; moisture may cause the dyes to dissolve or migrate; heat will cause cracking in the image layer.
It has been known since the end of the 19th Century that some colorants will be more stable in light if kept in oxygen-free conditions. In 1888, the Russell and Abney Report cited light fastness test results for a variety of watercolor materials, demonstrating that, in the absence of oxygen, the majority of colorants tested were seen to fade at a much slower rate or not at all. Since the Russell and Abney Report, several studies of the effects of anoxia have established that different dyes react differently, so that they have to be tested individually. For example, Prussian Blue, which is found in cyanotypes, will be adversely affected by the absence of oxygen, suffering a photo-reduction reaction and therefore fading.
Anoxic enclosures have been successfully used for the preservation of other museum objects (Maekawa 1998). Research into the application of anoxia to artists’ color materials is currently being carried out by the Getty Conservation Institute and Tate Britain (Beltran et al. 2008; Townsend et al. 2008). Yet, the application of anoxic environments to the display of photographic materials has been limited to a few objects of great value, such as Niépce’s Vue de Gras at the Harry Ransom Center in Austin, Texas, and The Cincinnati Panorama daguerreotypes from the Public Library of Cincinnati and Hamilton County, Ohio, for which an anoxic frame was designed by Ralph Wiegandt of George Eastman House in Rochester, New York.
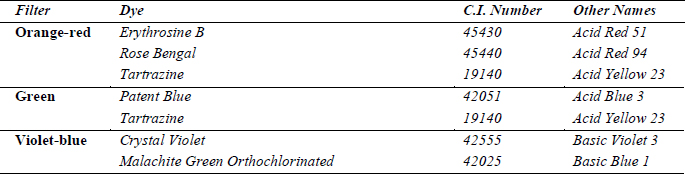
Prior to the present project, research on the application of anoxic environments to color photographic materials, such as Autochromes, had not been undertaken. There is thus no literature on the anoxic light fading behavior of such materials, and specifically of the six dyes present in the Autochrome color screen (table 1).
Table 1: Dyes in the Autochrome color screen
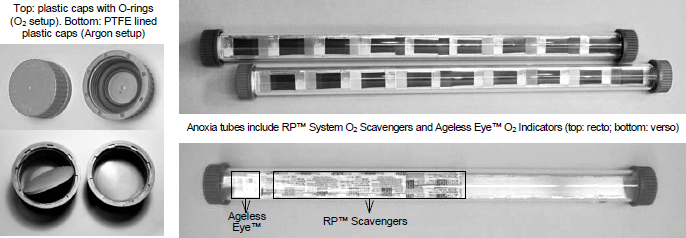
The experiment was designed with input from and the collaboration of colleagues and experts in the field. Samples were prepared following the historic dilution percentages of the dyes and varnish recipes. Because the purpose of the test was solely to study the color screen, the samples did not have a photosensitive layer. The experimental anoxia setup drew from past research methodologies but called for the development of an original protocol, using custom-made glass tubes sealed with caps. In order to achieve an anoxic environment, the tubes were first purged with argon gas. RP-K System™ scavengers were used to absorb any residual oxygen and monitoring of oxygen concentration was done with Ageless Eye™ oxygen indicators.3
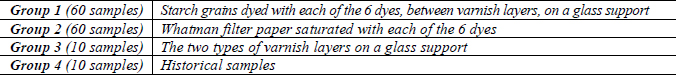
Four groups of samples were prepared (see table 2). The first group consisted of dyed potato starch grains4 on a glass support5 encased between two varnish layers. The purpose of this group was to observe the behavior of individual dyes as they are found in the structure of the Autochrome plate. The layering order for this batch of samples was as follows: glass/ first varnish/ dyed starch/ second varnish. The second group was created by infusing the colorants into separate pieces of Whatman filter paper.6 This group allowed the behavior of the dyes to be observed in isolation. The third group was created by applying two varnish layers to a glass support, to show changes such as discoloration or cracking. The layering structure here was: glass/ first varnish/ second varnish. The fourth sample group consisted of historical Autochrome plates. The use of historical samples in accelerated tests can be problematic since their processing and storage history is not known. In this experiment, the behavior of the historical samples served as a comparison with the results in the other groups, giving a measure of what might be expected with actual Autochrome examples.
For each of the four groups, ten duplicates were created, five of which were tested under anoxic conditions and five in a normal atmospheric environment, yielding a total of 140 samples.
Table 2: Groups of samples produced for the test
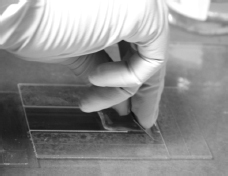
All the varnish layers on the samples were applied using a spreader to ensure a consistent thickness (fig.4).
The dyed potato starch grains in the first group were applied to the sticky varnish with a soft brush.
The paper samples were prepared by blotting them with cotton saturated with the dye.
Historical samples were purchased at flea markets and cut into small samples for testing.
Fig. 4. Applying varnish layer using a spreader
Prior to the fading test, benchmark readings were taken from the paper samples using an X-Rite 968 spectrophotometer. In the glass-supported samples, spectral data was collected using a Cary 50 UVVis Spectrophotometer. Polyester sheet overlays were used to ensure consistency of the measurement areas before and after exposure in the light-fading unit.
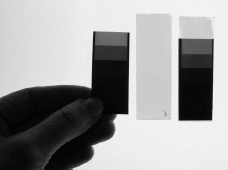
The samples (nine per tube) were assembled on aluminum strips, overlaid by five-step density grayscales to create a gradational fading rate for the dyes (fig.5). In each sample, one area was left fully exposed, while another was fully protected from light using aluminum tape.
Fig. 5. Grayscales were placed over the samples
Sample placement was made in a random manner in each tube, so that, in the event that one or more of the tubes should experience oxygen ingress, part of the data could still be retrieved.
The aluminum strips were placed inside custom-made, low expansion borosilicate glass tubes7 sealed on each end with plastic caps. The decision not to use heat-sealed glass ampoules, which would have been very efficient (Arney and Jacobs 1979), arose from the desire to create a practical and reusable experimental set-up that could be easily sealed, without requiring the services of a glass technician.
Achieving a successfully sealed oxygen-free environment inside the tubes involved several failed attempts - failure being caused by the permeability of the caps used initially. For the final setup, the caps used had a thick PTFE8 lining (fig.6.).
The eight anoxia tubes were filled with Argon gas humidified to 45% RH. The moisture content of the argon was adjusted before introducing it into the tubes by mixing the dry gas directly from a cylinder with moist gas which passed through a water trap filled with distilled water. The purging process of each tube was constantly monitored using an oxygen analyzer (Illinois Instrument, Inc. Model 911) and oxygen concentration was lowered to less than 500ppm. Three RP-3K System™ oxygen scavenger pouches were placed inside each tube to absorb any residual oxygen9, together with one Mitsubishi Ageless Eye™ oxygen indicator to monitor oxygen concentration during light exposure.
Fig. 6. Testing Setup
And additional eight tubes, identical in every way except that they contained normal atmospheric oxygen levels and did not include oxygen scavengers, were sealed in a 45% RH environment.
A third set of samples was kept in the dark, inside an aluminum foil pouch, under ambient conditions, as a control.
The tubes were wrapped in aluminum polyethylene foil to protect them from light and transported to the Image Permanence Institute at Rochester Institute of Technology, where they were placed for 54 days in a light fading unit with fluorescent lamps with very low UV content, emitting 6400lux10, for a total of 8.29Mlux-hours. This would be the equivalent to displaying an Autochrome on a common light box emitting 2000lux for 9 hours a day over a period of 20.95 months. An exhibition period of about 3 months would represent an exposure of 2Mlux-hours - one quarter of the total light fading test exposure.11
In the light fading unit, the lamps moved while the samples stayed in place to ensure the homogeneity of the light exposure of all the samples. Constant ventilation prevented heat build-up and maintained a temperature of 25°C, measured using a Raytek Raynger ST™ non-contact thermometer on the surface of the glass tubes.
After exposure in the light fading unit, the experiment tubes were wrapped in aluminum polyethylene foil and transported back to The Metropolitan Museum of Art. The samples were removed from the tubes as promptly as possible. Densitometry and spectrophotometry readings were made of each sample, measuring the five areas of graded exposure and the one control, giving a total of six measurements from each sample.
Graph 1 illustrates the ΔE12 values recorded by the samples from groups 1 and 2 (see table 2), in the area of the sample that was fully exposed to light. The results show the clear benefit to all the dyes, to a greater or lesser degree, from the anoxic environment. Clear instances of this are the Crystal Violet and Rose Bengal, which show a considerable decrease in fading under anoxic conditions. Malachite Green Orthochlorinated is the dye showing the least benefit from anoxia. Tartrazine is the most stable dye and shows very little fading in any environment.
A full account of the data resulting from the test will be included in a future article.
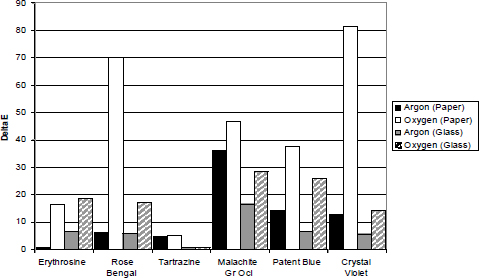
Graph 1: Relative stability of glass and paper samples based on ΔE76
The microfader is an analytical tool that collects light fading data on a minute testing area (100µ in diameter). The assessment of lightfastness is done at a very early stage of fading that is not discernable by the human eye but is measurable by the spectrophotometer. The microfader combines in its probe a single optical fiber cable that focuses an intense light on the area to test, and a spectrophotometer that measures the resulting change.
In collaboration with Chris McGlinchey at the Museum of Modern Art in New York, accelerated aging studies were conducted on test samples of dyed Whatman filter paper using a microfader unit fitted with a close contact bifurcated fiber optic head designed to purge oxygen from the sample area during the test. Were this method to prove a viable means of carrying out tests in anoxia, it would then be possible to assess the benefits of anoxic exhibition without having to create a chamber for the entire object, making it much more convenient and economical to evaluate individual objects. Preliminary results are promising and will be the subject of a future publication.
Developing the methodology for anoxic testing was challenging. The choice of a reusable system of glass tubes with caps provided a successful setup for creating an anoxic environment. The Autochrome dye samples exposed to light in normal environment conditions show a marked color shift due to light exposure. The results of the experiment demonstrate the clear benefit of anoxia in decreasing the fading rate, though the complete arrest of fading was not achieved. The protective role played by the varnish layers is confirmed, as is evident from a comparison between the results from the samples of dyes in paper with those from the dyes on a glass support, which show a significant difference (table 2, groups 1 and 2). The specific results of the test, together with their interpretation, will be published in the near future. By analyzing the gradational fading data, it will be possible to establish precise light level recommendations for Autochrome display under anoxic conditions.
This research was made possible by the support of the Andrew W. Mellon Foundation. The author would like to thank colleagues at The Metropolitan Museum of Art: above all Nora Kennedy for her supervision and guidance; Malcolm Daniel and the Department of Photographs for all their encouragement; and Marco Leona, Masahiko Tsukada, Silvia Centeno, Nobuko Shibayama and Federico Carò of the Scientific Research Department for their great technical and scientific support. A special acknowledgement is due to Bertrand Lavédrine who helped design the project and gave technical advice through the many stages of the experiment, and to James Reilly and the Image Permanence Institute for generously allowing the use of a light fading unit and giving technical support. I also owe thanks to Dan Burge and Andrea Venosa, and a special acknowledgement to Doug Nishimura for his prompt response to my many questions. Tak Izawa and Mitsubishi Gas Chemical America provided the oxygen scavengers and indicators for the experiment. A grateful acknowledgement is due to Chris McGlinchey and Jim Coddington at the Museum of Modern Art for use of their microfading instrument. My thanks go to Guida Casella for the clear illustrations of this complex process. Finally, acknowledgement is due to the many experts and colleagues who have contributed comments on the experiment and this article, especially Jim Druzik, Tim Padfield, Tim Vitale and Paul Whitmore, but also Lisa Barro, Hanako Murata, Sylvie Pénichon, Antonin Riou, Gawain Weaver, Mark McCormick-Goodhart, David Saunders, John Tagg and Ralph Wiegandt.
Arney, J. S., A. J. Jacobs and R. Newman. 1979. The Influence of Oxygen on the Fading of Organic Colorants. Journal of the American Institute for Conservation 18: 108–117.
Beltran, V., J. Druzik, and S. Maekawa. 2008. An Extended Investigation of the Influence of Oxygen on Color Fading. Poster presented at the ICOM-CC 15th Triennial Conference, New Delhi, India.
Hammond, A. 1994. The Autochrome and the Photo-Secession. History of Photography 18(2). London – Washington D.C.: Taylor & Francis.
Krause, P. 1985. Preservation of Autochrome Plates in the Collection of the National Geographic Society. Journal of Imaging Science 29 (5):182–192.
Lavédrine, B. and J.P. Gandolfo. 1993. La plaque Autochrome : Analyses Physiques et Chimiques, Étude de la Stabilité des Colorants. ICOM Committee for Conservation preprints. 10th Triennial Meeting, Washington, D.C.. Paris: ICOM. 1:275–280.
Lavédrine, B. 2009. L’Autochrome Lumière. Secrets d’Atelier et Défis Industriels. Paris: Editions CTHS.
Maekawa, S. 1998. Oxygen-Free Museum Cases. USA: The J. Paul Getty Trust.
Passafiume, T. 2005. Photography in Natural Colors: Steichen and the Autochrome Process. In Coatings on Photographs: Materials, Techniques and Conservation, ed. C. McCabe. Washington, D.C.: American Institute for Conservation of Historic and Artistic Works.
Russell, W.J., and W. de W. Abney. 1888. Report to the Science and Art Department of the Committee of Council on Education, on the Action of Light on Watercolours. London: Great Britain Education Department, HMSO.
Townsend, J., S. Hackney, J. Thomas and A. Lerwill. 2008. The Benefits and Risks of Anoxic Display for Colorants. Conservation and Access, ed. D. Saunders, J. H. Townsend and S. Woodcock. IIC: London. 76–81.
Wagner, S., C. McCabe and S. Lemmen. 2001. Guidelines for Exhibition Light Levels for Photographic Materials. Topic in Photographic Conservation 9. AIC: Washington D.C. 127–128.
Vitale, T. 1998. Light Levels Used in Modern Flatbed Scanners. RLG DigiNews 2(5). http://www.worldcat.org/arcviewer/1/OCC/2007/08/08/0000070519/viewer/file3571.html#technical (accessed 8/15/2009)
LUISA CASELLA
Andrew W. Mellon Research Scholar in Photograph Conservation, The Metropolitan Museum of Art, New York NY.
1 Because the color screen faces the subject during exposure, to observe an Autochrome in the correct orientation, the silver image layer should face the observer.
2 The Museum System© is a commercial database developed by Gallery Systems, used by many museums in the USA and abroad.
3 RP-K System™ oxygen scavengers do not affect the relative humidity levels within the sealed environment. These and the oxygen indicators were generously provided by Mitsubishi Gas Chemical America.
4 Each dye was tested individually rather than in the mixtures found in the Autochrome color screen to form the red, green and blue grains (see table 1).
5 1mm thick microscope glass slides were used as support.
6 Whatman Qualitative Filter Paper No.1.
7 The tubes were manufactured by Kimble-Kontes using Corning Pyrex 7740, which has a refraction index of 1.474.
9 RP-K System™ oxygen scavengers are available in two levels of oxygen absorption: 300cc (RP-3K) and 500cc (RP-5K). Tak Izawa from Mitsubishi Gas Chemical America calculated that 3 pouches of RP-3K in each tube would provide an excess of scavenger to absorb residual oxygen for the volume of the tubes.
10 Twelve cool fluorescent lamps (Sylvania F40/CWX).
11 Although in actual exhibition conditions, original Autochromes would not be constantly illuminated but would more likely be displayed using a motion or visitor activated light box.
12 The equation used was ΔE 76 following what was used in most of the references.
Papers presented in Topics in Photographic Preservation, Volume Thirteen have not undergone a formal process of peer review.