Topics in Photographic Preservation 1989, Volume 3, Article 14 (pp. 112-122)
Infrared spectrometry is one of the techniques which help determine the organic structure of unknown material. In this technique, the different atomic bonds in the sample are absorbing infrared radiation at different frequencies. The percentage of radiation absorbed at each frequency is measured and the spectrum obtained permits to characterize the chemical nature of the sample. For example, gelatin and collodion will absorb at specific frequencies which enable the analyst to distinguish one from the other.
Infrared spectrometry has been widely used in the conservation field. Materials such as pigments, synthetic coatings, waxes, oils and natural resins have been analyzed by this technique, for identification purposes or for aging studies. When the technique first came into conservation, the low sensitivity of the optical infrared spectrometer then available required large samples to be taken from the artifact. Today, with modern Fourier transform spectrometers, the sensitivity has been greatly improved and only very small samples are now necessary. However, for art objects, the ideal technique would be not to require any sampling at all.
This is now made possible through the use of an infrared microscope attached to a Fourier transform infrared spectrometer.
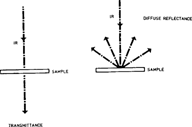
In traditional infrared spectrometry, the infrared radiation is measured after it has passed through the sample, therefore obtaining a transmittance spectrum. (figure 1)
The use of the microscope attachment also permits to obtain infrared spectra through diffuse reflectance. The object to analyze is placed on a large matboard attached to the microscope stage. Used in normal light, the microscope permits to focus on the area chosen for analysis. The system is then switched to infrared light and a diffuse reflectance spectrum of the object surface is then recorded through the spectrometer. In diffuse reflectance (figure 1) the infrared radiation is analyzed after it has been reflected by the irradiated sample. This means that only the surface of the object is analyzed. Diffuse reflectance is the method of choice for samples too thick to let radiation through or for opaque samples such as photographs on paper and board.
In this study, we have investigated the possibilities to use diffuse reflectance to study photographic materials and identify rapidly the binders of the emulsions and the polymeric basis of negatives.
A Spectra Tech Infrared Plan Microscope attached to a model 1750 Perkin-Elmer Fourier transform spectrophotometer was used. This attachment permits to analyze an area of 1.3mm in diameter or even smaller. On every photograph we were therefore able to analyze highlights, midtone and dark areas. The paper without emulsion was also analyzed when possible.
We had as reference a set of fabricated samples and a series of photographs from early 1900 with identification of their process written on the back by the author. The other samples were made in the laboratory by dipping paper strips, glass slides, and Mylar strips into baths of gelatin, egg white, egg yolk and collodion. Free film of binders were obtained by peeling them off the Mylar strips.
Very soon, it became obvious that the spectra obtained from diffuse reflectance were different from the transmittance spectra. The presence of paper as background interferes also with the resultant spectra which then combined both absorptions from the binder and the paper.
Figure 2 represents a standard transmission spectrum of gelatin (pale line) compared to the diffuse reflectance spectrum of gelatin on paper (darker line). We can observe here the two principal bands that will serve to identify gelatin, the amide I and amide II bands identified here by stars in the area of 1500 to 1700 cm. We can see that the two bands have shifted to higher frequencies in the gelatin on paper spectrum. We also observe broadening of the bands and a general loss of resolution at the lower frequency end.
On other occasions, we observed bands reversions, a phenomenon well known to spectroscopists which can be observed in the spectrum of collodion on paper (figure 3) where the absorption band is suddenly reversed at 1300 cm -1.
However, these changes occurred systematically and the spectra could still be used as references. But it also meant that the transmission spectra of the literature could not be used in our study.
After recording the spectra of the samples and the reference photographs, comparisons were them made to distinguish the different binders.
The first step was to make sure than the spectra of the binders could be clearly differentiated from the spectra of paper alone. Figure 4 represents the spectrum of gelatin on paper (darker line) and of paper (paler line). The two amide bands of the gelatin are here clearly visible and distinct from the large band of the paper around 1650. Spectra of the other binders were also clearly distinct from the paper.
We then made sure that it was possible to distinguish the different binders one from each other with their infrared spectra. As we can see on figure 5, it is clearly possible to differentiate collodion from gelatin. The two amide bands (pale line), are very distinct from the cellulose nitrate band in black at 1680 and the overall appearance of the spectra are very different.
The distinction between gelatin and egg albumen is a more delicate one (figure 6). Both being proteins, they both show strong amide I and amide II bands in the same frequencies' range. By studying not only the prepared reference samples but also the photographs, it was found that in general the amide bands of albumen were at lower frequencies than the corresponding gelatin bands. On figure 6, the egg albumen bands (dark line) are very close to the gelatin bands although the band of albumen, at 1680 is at a lower frequency. For comparison we also noted that in all the spectra of gelatin photograph the amide bands were always at the same frequencies. The albumen bands, on the other hand could shift irregularly at lower frequencies. Some spectra of albumen photographs presented absorption bands closer to egg yolk than pure egg albumen but without the peak of the fat of egg yolk near 1750, which is what we observe on figure 7, the pale line being an albumen photograph and the dark line egg yolk on paper. Both these spectra are clearly distinguishable from gelatin. It is important to note that the different recipes used to prepare the emulsions could very well influence the results obtained, and it stresses the importance of studying several photographs of different origin.
Then continuing to compare the photographs and prepared sample, figure 8 shows the very good correspondence between the gelatin reference sample and a photographed labelled “gelatin Printing-out-Paper.”
However, there were cases where additives or special preparation of the paper caused differences in the spectra. Figure 9 shows a case where the finishing of the paper has an influence on the infrared spectrum. We see a commercial paper,“Kodak Studio Proof” (pale line), and the spectrum of gelatin on paper (dark line). Here, a white preparation on the commercial studio proof paper has absorbed strongly in the 1100 area. But the amide bands clearly indicate the presence of gelatin.
On figure 10 a photograph labelled “matte collodion paper” is compared to the prepared standard of collodion on paper. The two spectra correspond very well except for additional bands in the reference sample. We found that these bands, identified by stars, were due to the presence of castor oil in our collodion preparation. Quite evidently, the oil has not evaporated after several days of drying. This stresses again the influence of the binder recipe in the result obtained.
After studying the photographs we then looked at different types of negatives. The problems encountered then were of a different nature.
Cellulose acetate and cellulose nitrate negatives were coated on both sides with thick gelatin layers. The whole layered structure was too thick to be analyzed with transmittance infrared. As for diffuse reflectance, we recorded only the gelatin layer, the infrared beam being reflected before it could reach the polymeric core.
With a commercial cellulose nitrate negative, we were able to obtain a spectra by dissolving a small sample in ethyl acetate and casting the obtained solution on a potassium bromide pellet. This method is more traditional and enables to obtain transmittance spectra comparable to the ones in the literature (figure 11).
Glass plates present a problem of a different kind. The glass itself absorbs most of the infrared radiation over a wide range of frequencies, obscuring completely the emulsion bands when transmittance is being used. Diffuse reflectance could be here an answer. Recording a spectrum in a thick area of the negative enables to diminish the influence of the glass plate. However, it seems that the spectra obtained still suffer from several distortions that need to be resolved.
In conclusion, we can see that this study has answered our questions only partially. However, we now know it is possible to distinguish gelatin, collodion and albumen on paper. The study of negatives is still continuing and we will investigate means to identify the acetate and nitrate negatives without sampling. As a whole, the study has been very encouraging and the use of the microscope attachment has opened new areas of research. This investigation will continue to include more of the old photographic processes and survey a greater number of photo material of various origin.
Johanne Perron
March 1989

Figure 1
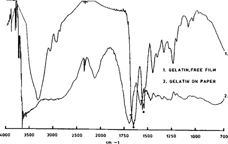
Figure 2
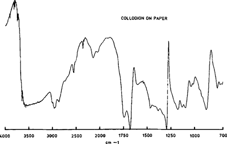
Figure 3
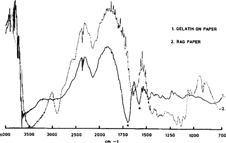
Figure 4
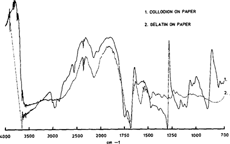
Figure 5
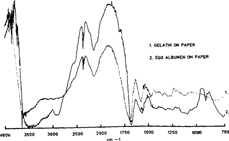
Figure 6
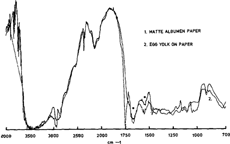
Figure 7
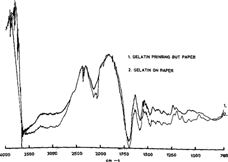
Figure 8
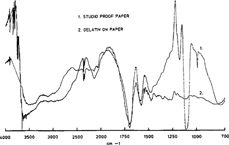
Figure 9
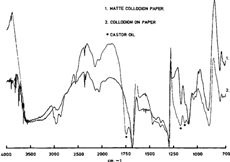
Figure 10
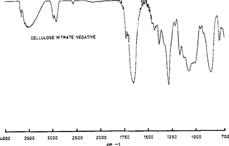
Figure 11