Topics in Photographic Preservation 1989, Volume 3, Article 17 (pp. 151-172)
A technique using commercially available electronic scanners to produce restored four-color separations from dark faded transparencies has been examined. The ability of the scanner to make adjustments in the tonal gradation of each dye layer, based on actual dye loss due to dark fading, has been noted. Comparisons between test separations and results obtained using the Dupe Mask Method have been made. Results of initial restorations, are favorable.
Color transparencies are subject to dye loss even when stored under dark conditions. Such dark fading takes place through complex chemical reactions occurring primarily as a result of temperature and humidity. Such fading occurs at normal room conditions, but also takes place at a faster rate under high temperature and/or high relative humidity. Cold storage facilities, with carefully regulated temperature and humidity controls, have been installed by many photographic repositories in response to this phenomena. However, transparencies which have already suffered the effects of dark fading require special treatment to be made usable once again.
The amount of dark fading dye loss varies with film type, storage conditions, age, and a variety of other factors. However, dark fading is generally proportional to the amount of dye which existed in the original transparency. This proportional dye loss is the same as an overall contrast shift for the dye layer involved.1 It is this assumption which formed the basis of previous restoration techniques, as well as the tests described here.
Dye stability varies from emulsion layer to emulsion layer within a transparency. Typically in Ektachrome type materials the greatest dye loss occurs in the cyan layer, with somewhat lesser fading in the yellow layer. The magenta layer is the most stable of the Ektachrome type dyes.
March, 1989
Because dark fading is proportional, a 30 percent cyan dye loss means that 30 percent of the dye has been lost in both heavily saturated shadow areas, as well as less saturated highlights. To restore the transparency to its original level, more color density must be replaced in the shadows than in the highlights. For this reason the addition of overall filtration during normal duplication techniques is not successful. The use of such filters introduces a uniform level of additional color throughout the image.
It has been possible for some time to make restorations of dark faded transparencies using several photographic methods. An early technique involved the use of adjustments during the tricolor printing process.2
In July 1979, Eastman Kodak published two methods for restoring dark faded transparencies using Ektachrome Duplicating Film 6121 and Ektachrome Slide Duplicating Film 5071.3 Both methods were based on densitometer readings taken in a maximum density area of the faded transparency. Generally, this reading was made on the black, unexposed border of the transparency. For purposes of the restoration techniques, it was assumed the original density of each of the three dye layers was 3.20.4 Using the difference between 3.20 and the readings from the faded transparency, the percentage of dye loss for each layer could be calculated.
Method No. 1, the Dupe Mask Technique, involves two white light exposures onto one sheet of duplicating film. The first exposure is made through the registered combination of the original and its duplicate (showing the same fade as the original). The second exposure is made through the faded original alone with a standard white light modified to withhold exposure in the faded dye layer.
Method No 2, the Flashed Dupe Mask Technique uses a flashed mask which resembles the dye which has been lost in the original.
In January 1981, Eastman Kodak published an additional method using Kodak Vericolor Internegative Films 4112 and 6011.5 With this technique corrected duplicate transparencies are produced by increasing exposure of the dye layers of an internegative which correspond to the faded layers of the original transparency.
In 1981, the Color Laboratory Branch of the Smithsonian's Office of Printing & Photographic Services attempted restorations of three 4×5 Ektachrome transparencies using Method No. 1, the Dupe Mask Technique. Two of the restorations were judged highly successful and the third was judged acceptable at the time. Even so, the experience demonstrated that the process was both time-consuming and extremely critical. The procedure assumes the existence of a well-controlled transparency duplicating facility and E-6 processor, as well as the ability to accurately punch and pin register film prior to exposure. At least two E-6 processing runs are required, (one for the dupe of the original, the second for the processing of the restoration). Overall, it was estimated that approximately four hours were needed to complete the process, and that only a very limited number could be done at one time. It was also felt that the technique would be extremely difficult if not impossible to use with 35mm originals, due to the problems of accurately registering the very small pieces of film.
Based on this experience, it was determined that while the technique worked very well, it would be reserved for only limited use – especially where publication of the restoration was the goal.
Since the need to publish a faded transparency is one of the primary reasons to justify the time and expense of a restoration, it was decided to test the use of electronic scanners for this purpose. Publications require the creation of four-color separation halftones anyway. If the scanner could also perform the needed color replacement, restorations could be made at little or no additional expense to that needed for normal separations.
During the last decade, an increasing percentage of halftones and four-color separations have been made with electronic scanners. The principal scanners currently being used in this country are manufactured by Crosfield, Hell, or Dianippon Screen. The equipment operates by making an extremely high resolution scan of the original film and converting the information into electronic form. Early electronic scanners used a combination of analog and digital technology. More recent scanners are all digital. In addition to being able to provide an extremely accurate reproduction of an original photograph, the image information can also be manipulated, both in terms of output color, and the form of the image itself. Because of this ability to easily manipulate images, the equipment has become popular in advertising and other media where the assembly of multiple photographs into a final image is required.
The equipment has also been the subject of considerable criticism, especially among photojournalists, when it has been used to alter the content of editorial photographs.6
For purposes of these experiments, however, it was hoped to determine if a scanner could electronically emulate the results of the restoration techniques previously described. That is, could the equipment adjust contrast in the color layers scanned from a dark faded transparency in the same way photomechanical masking and filtration were used previously?
A group of four, 4×5 transparencies and one 35mm transparency were chosen for testing. Two of the 4×5′s had been used in 1981 for the Dupe Mask restorations described previously. It was hoped that these two transparencies would provide a direct comparison between the results obtained by the existing and experimental methods.
The 35mm Ektachrome slide was chosen both to try the scanner technique on a film size judged difficult for the previous method, and because while it showed some visible deterioration it had not dark faded to the extent of the 4×5′s.
The 4×5 transparencies were originally taken in 1964. The 35mm slide was originally taken in 1963.
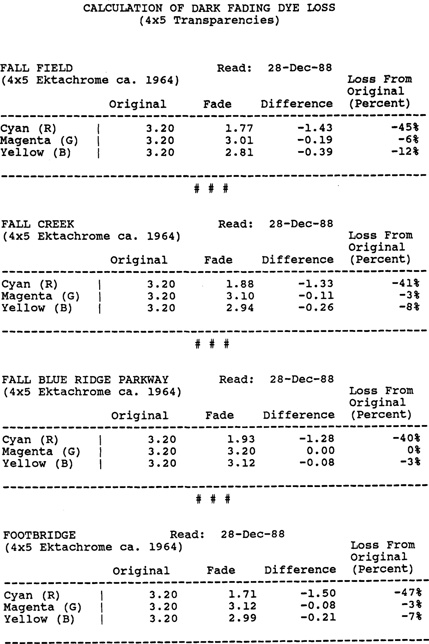
Densitometer readings were made from the unexposed borders of the slide and transparencies, using a Macbeth TD504 transmission densitometer. Three separate readings were taken of each transparency and the results averaged. These readings were used to calculate the amount of dye loss which had occurred in each transparency (Figures 1 and 2).

FIGURE 1: Calculation of Dark Fading Dye Loss, (4×5 Transparencies).
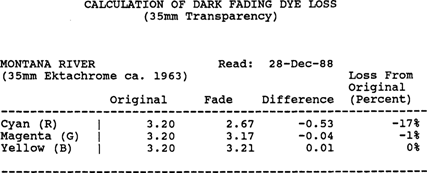
FIGURE 2: Calculation of Dark Fading Dye Loss, (35mm Transparency).
This information, while of interest, did not have a direct correlation to the settings of the scanner. Since the scanner output was to be four-color separations, final results were judged in terms of dot area percentage.
To provide optimum printing reproduction, the scanner is normally set to produce a maximum density dot pattern not to exceed 95 percent for each color. Based on this, the technique used for the scanned restorations was to set the scanner to reproduce the remaining maximum density value of each transparency dye layer as a 95 percent halftone dot. At the same time, the overall tonal gradation of each layer would be likewise corrected accordingly.
The tests were designed to demonstrate that effective restorations could be made during the original scan itself. That is, the electronic tone gradation adjustments would only be made based on the readings obtained from the faded transparency by the scanner. Later, the scanned digital information was not to be subjectively manipulated based on individual judgements by the scanner operator. In this way it was hoped to emulate as closely as possible the intent behind the previously used photomechanical restoration methods.
The scans were all made by Applied Graphics Technologies of Washington, D.C. using an all digital Crosfield Scantex 315 scanner. The final negatives were generated as 133-line, four-color separations by a Scitex Raystar output system. In each case, the density of the black printer produced during the separation process was kept to a minimum, or “shadow black” level. In this way, the effect of the three primary colors was easier to judge without the added consideration of the black contrast mask and/or under color removal.7
Two scans were made of each subject. The first was a normal scan, with the results being an accurate reproduction of the faded original. The second scan was made to restore the lost color.
In addition, normal scans were also made of the two duplicate transparencies produced by the Dupe Mask restorations in 1981. In this way, a visual comparison between the two techniques could be made.
To graph the gradation adjustments made during the scans, a continuous tone, graphic arts, carbon gray scale was included with each of the 4×5′s. Carbon is used in this scale because of its extremely neutral color. The scale is incremented by density in steps ranging from .10 to 3.00. The 35mm original was too small to allow inclusion of the scale. Since there were no gray scales in the images of the original transparencies, a comparison would be made between the gray scale scanned with the faded transparency, (which would plot normally), and the corrections which would show in the gray scale scanned with the restoration.
To visually judge the effectiveness of the tests, match prints were made from the color separation negatives. An additional set of negatives was also generated and used for offset printing the results.8
A visual review was made of the match prints comparing the normal scan of the faded originals, vs. the scan for restoration. The results were striking. In each instance, the visual results appeared to be an extremely successful restoration. Careful examination of the “before” and “after” images revealed some increase in contrast, however. This appeared in the form of some loss of extreme highlight density. Further examination of the four-color dot pattern through a magnifier, confirmed there had been some reduction of color density in the extreme highlight areas. Overall, however, the restorations were clearly considered successful.
Of special interest were the results of the 35mm slide “Montana River”. This evaluation was all visual, as no gray scale could be included in the scans. Here too, the results were judged as very successful. This was considered especially significant as the fading was not as great as in the 4×5′s, yet the technique had worked well without over correcting. In addition, the 35mm scan was no more difficult than that of the larger 4×5′s. It is believed that the masking and registration needed in the Dupe Mask technique would have made any successful restoration of the 35mm original far more difficult to obtain.
A visual comparison was made of match prints from the normal scans of the Dupe Mask restorations and the scanner restorations of the transparencies “Fall Field” and “Blue Ridge Parkway”. Overall, these results were also considered very successful. They did reveal minor contrast differences, however. In this regard, some consideration may have to be given that the Dupe Mask and scanner restorations were made more than seven years apart. During the intervening period the two original transparencies had not been in cold storage, and as a result had faded further.
Readings taken in 1981 of “Fall Field” indicated a 37 percent cyan loss, a 3 percent magenta loss, and a 9 percent yellow loss. As shown in Figure 1, the 1988 readings of the same transparency showed a 45 percent cyan loss, a 6 percent magenta loss, and a 12 percent yellow loss.
Densitometer readings taken in 1981 of the transparency “Blue Ridge Parkway” showed a 32 percent cyan loss, no magenta loss, and a 2 percent yellow loss. The same readings taken in 1988 showed a 40 percent cyan loss, still no magenta loss, and a 3 percent yellow loss.
Thus, the scanner had somewhat more color loss to adjust, especially in the cyan layer.
Using the four-color separation negatives, densitometer readings were taken of the gray scales which had been included in each of the 4×5 scans. Readings of dot area percentage were made using a Macbeth TR927 densitometer. Three separate readings were taken for each increment on the gray scales and the results averaged.
The gray scales scanned with the photographs “Fall Field”, “Blue Ridge Parkway”, “Fall Creek”, and “Footbridge” all displayed similar characteristics when plotted. For purposes of this report only one, the data from “Fall Field”, is presented as typical in Figure 3.
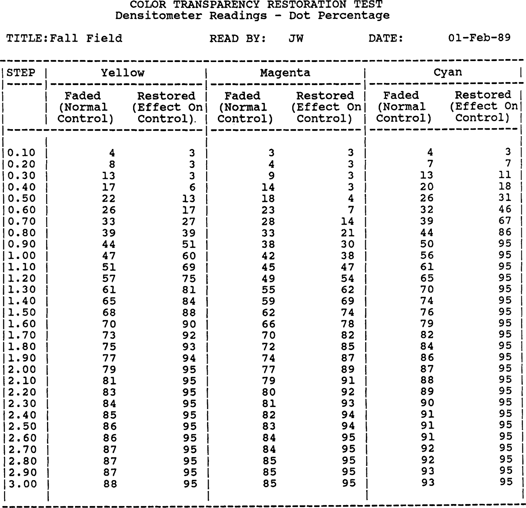
FIGURE 3: Dot area percentage densitometer readings, “Fall Field”.
The normal control strip, (scanned for the accurate reproduction of the faded transparency), is shown in its entirety in Figure 4. The same strip from the scan made for restoration is also shown in its entirety in Figure 5.
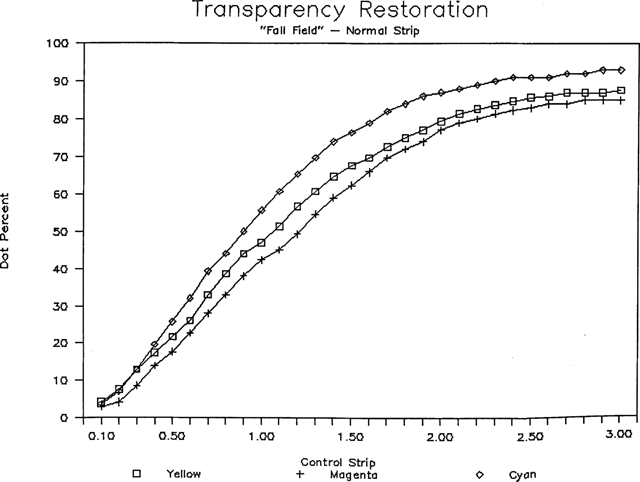
FIGURE 4: Graph, normal gray scale, “Fall Field”.
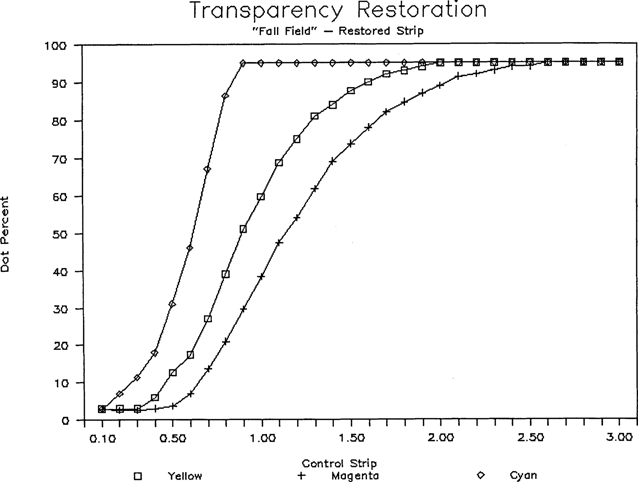
FIGURE 5: Graph, restored gray scale, “Fall Field”.
In the graph of the restored scale, all three curves peak and flatten dramatically at the shoulder. This is because the scanner will not produce a dot coverage greater than 95 percent. In the restored scan, as predicted, it was noted that the maximum correction was to the cyan negative, followed by the yellow negative. The magenta negative received only minimal correction at the shoulder.
For each individual color, the normal curves were then superimposed on the restored curves as shown in Figures 6, 7, and 8.
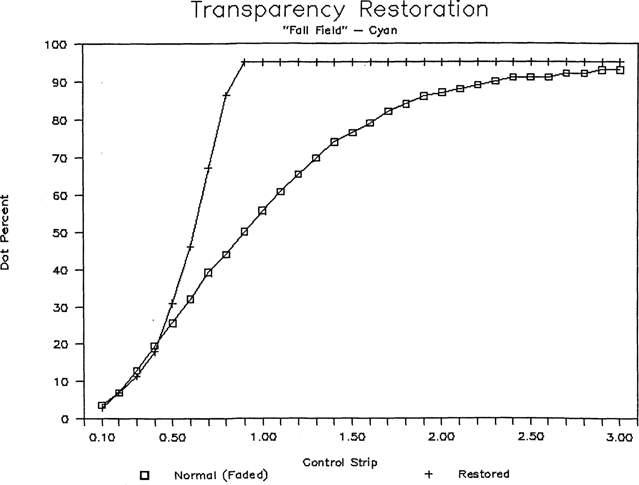
FIGURE 6: Graph, full cyan curves before and after restoration, “Fall Field”.
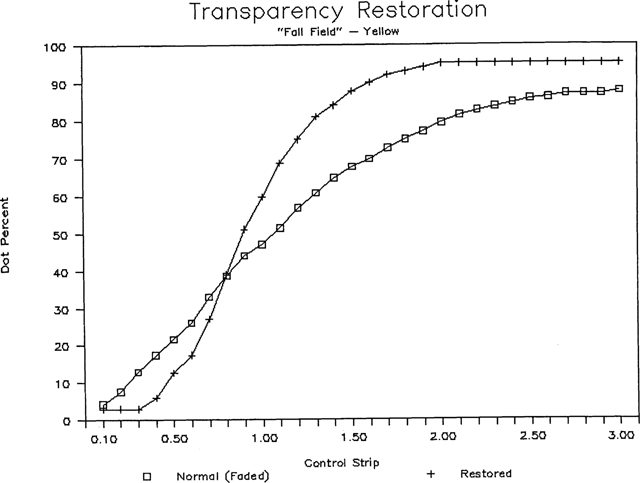
FIGURE 7: Graph, full yellow curves before and after restoration, “Fall Field”.
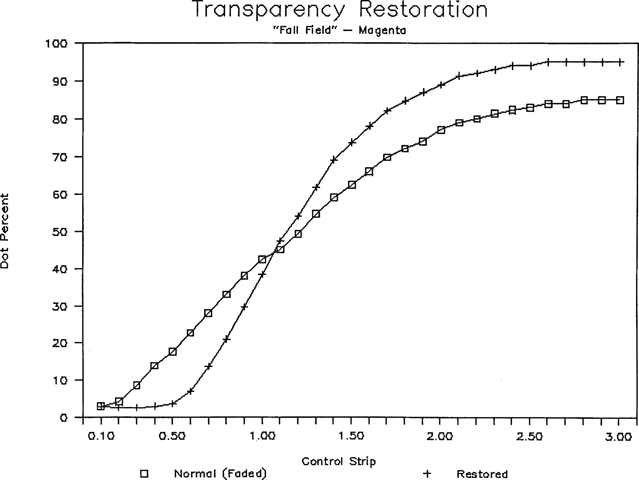
FIGURE 8: Graph, full magenta curves before and after restoration, “Fall Field”.
From the resulting graphs, the effects of the restoration on each dye layer can be seen. The technique had called for the scanner to determine the maximum density remaining in each dye layer of the faded transparency, and translate that value into a 95 percent dot, adjusting the tonal gradation throughout the layer accordingly. Therefore, the point at which each restored curve peaks at 95 percent represents the point of maximum remaining density in that layer of the faded transparency. Each curve was then re-scaled, terminating the shoulder at the point it reaches a 95 percent dot. This adjusted curve was then superimposed over the same area of the normal curve as shown in Figures 9, 10, and 11.
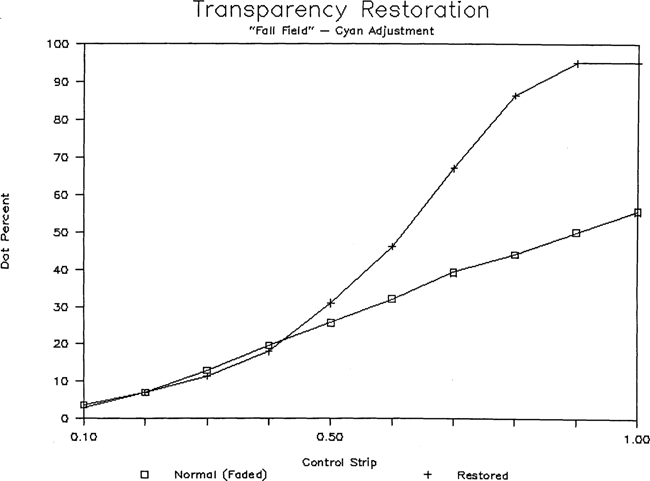
FIGURE 9: Graph, adjusted cyan curves before and after restoration, “Fall Field”.
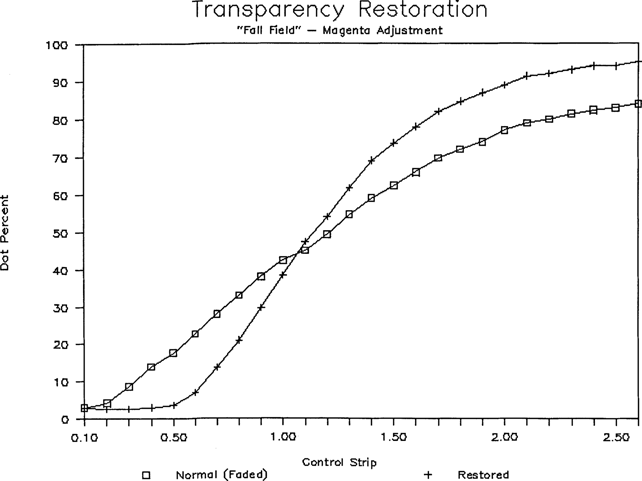
FIGURE 10: Graph, adjusted yellow curves before and after restoration, “Fall Field”.
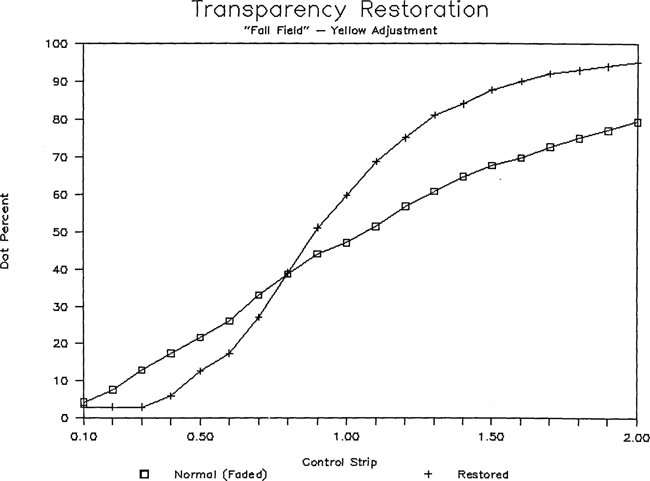
FIGURE 11: Graph, adjusted magenta curves before and after restoration, “Fall Field”.
Based on these comparisons, and the varying points at which each color achieves a 95 percent dot, it was confirmed that the scanner had, as hoped, adjusted each dye layer individually based on the degree of fading in the original.
Further, a comparison was made between the relative values of the curves at the point where the restored curve reaches the 95 percent dot. At that point, the difference between the curves approximated the ratio, if not the actual percentage of dye loss for that layer as predicted in the original densitometer readings.
The densitometer readings of the restored scales also showed the loss of some density in the highlights when compared to the normal curve. This was especially true in the magenta and yellow negatives. This data confirmed the visual observations which had been made previously.
Within the limited tests conducted thus far, the potential for the use of electronic graphic arts scanners to restore dark faded transparencies appears to be substantial. This technique could be especially useful where publication of a faded original is needed. In these cases, color separations are required anyway. Therefore the scans using this technique would create little or no additional cost to the normal separation process.
However, additional testing is indicated, especially as regards the reproduction of yellow and magenta highlight values.
It is also believed that variations of this technique could be useful in the restoration of light faded transparencies, and possibly with badly damaged black & white negatives or even glass plates. In the latter cases, final output would be to continuous tone film rather than halftone negatives.
Note - Potential users of this technique are cautioned that restorations should be made using only tonal gradation adjustments, as opposed to color corrections. Use of the scanner's ability to make complex color corrections would render it impossible to track or graph the restoration process.9 The results would, therefore, be a selective, or subjective addition of color, and not an attempt to recreate the densities of the original transparency.
The author wishes to thank Mr. Frank C. Scott, Vice President for Technology of Applied Graphics Technologies, for his assistance in planning and supervising the scans and separations associated with this work. His insight and grasp of the problem and its potential solution added immeasurably to the final results.
Thanks are also due to Mr. Joe A. Goulait, Chief of the Color Branch, Office of Printing & Photographic Services, Smithsonian Institution. Mr. Goulait performed the majority of the work in the Dupe Mask restorations conducted in 1981, and provided additional assistance in the completion of this experiment.
1. “Restoring Faded Transparencies By Duplication” (White Light Printing Methods), CIS-22, Eastman Kodak Company, July 1979.
2. ibid.
3. ibid.
4. ibid.
5. “Color-Corrected Duplicates from Faded Color Transparencies Using Copy Negatives of Kodak Vericolor Internegative Films 4112 & 6011″, CIS-28, Eastman Kodak Company, January 1981.
6. The ability to modify the editorial content of photographs, seemingly without detection, has been the subject of considerable controversy. The most widely cited examples have been two National Geographic covers and the dust jackets of several books in the Day In The Life of… series.
7. Personal communication, Frank Scott, Vice President for Technology, Applied Graphics Technologies, Washington, D.C.
8. “Electronic Scanner Restoration: Recovering Lost Color From Faded Transparencies”, a supplement to this report.
9. Personal communication, Frank Scott.