Topics in Photographic Preservation 1995, Volume 6, Article 2 (pp. 11-40)
The intention of this investigation was to test two commercially available indicators, Film Decay Detector Sensor® “FDD” and Danchek® which claim to monitor the degree of degradation of cellulose acetate-based film. Preliminary results have shown that the indicators might be useful. However, their use does involve some subjectivity, since a visual evaluation is required. Some questions have been raised about their long-term stability, which tends to be a problem with any type of acid-base indicator. In addition, studies were done on “home-made” indicator papers to determine if a more sensitive, short-term, semi-quantitative test could be designed. The results obtained are preliminary but acid-base indicators do seem to offer a way of quickly determining an approximate acidity level in film.
The environment affects the state of preservation of photographic film. Film left in a poor storage environment will soon begin to lose its strength and image stability. The self-catalyzed production of acetic acid from side chains of the cellulose acetate support may also cause emulsion degradation and emulsion-base separation, as well as accelerate the rate of deterioration in adjacent films. One method for noting the presence of acids inside a film container is by detecting the acetic acid “vinegar” odor generated. Not only does this involve some subjectivity, but also it can be hazardous to one's health. Therefore, a better method is needed to quickly detect when the first signs of acid are present.
In the past, the use of passive monitors developed for industrial purposes have been applied to the detection of air pollutants in museum environments. Some simple, economical and passive monitors have been developed based on the reactions of pollutants such as formaldehyde, acetaldehyde, acetic and formic acid with specific reagents.1,2 Passive monitors involving acid-base chemistry have recently been developed for the monitoring of the degree of degradation of cellulose-acetate based film. The acetic acid which is generated lowers the pH, causing the indicator to change color. The use of such an indicator may enable the staff to act before it is too late for the duplication of the affected negatives.
The number of compounds having acid-base indicator properties is very large and comprises of a variety of organic structures. An indicator covering any desired pH range can ordinarily be found.
The effectiveness of an indicator will depend on certain factors which were taken into consideration for this study. They include the following:
1. Indicator concentration should be quite low. Generally, a less concentrated solution is more sensitive.
2. The presence of foreign neutral electrolytes “salt effect” alter the equilibrium, usually shifting it to a higher pH, and decreasing color intensity.
3. Proteins and colloids may absorb the indicator and change color.
4. Solvents which are acidic may change the indicator.
5. Temperature may also affect the transition interval, causing indicators to shift more quickly to either a basic or acidic color.3
Among the many possible indicators, only a few will satisfy the need to detect acetate film degradation. The indicator must be able to detect a weak acid “acetic acid” at the pH range of about 4–6.
Two commercial indicator products are sold in a button form and are used to detect acetic acid in 35mm motion picture film cans. Holes are drilled into the side of the cans, so that the indicator is directly exposed to the air in the can but can be viewed from the outside. One advantage to this approach is that the presence of acetic acid can be detected rapidly, without opening the can. Both manufacturers claim that their product works on a long-term basis.
Danchek® contains an indicator, possibly bromcresol green4 dispersed in silica gel. The system is packaged in a plastic container which is then inserted into the side of the film can. The silica gel is then exposed to the air inside the can. The initial color is green “pH 5.4”; when in the presence of acetic acid, the color shifts to yellow “pH 3.8”.
The Film Decay Detector®, FDD, is similar in its application. The indicator is probably the same as that used in Danchek® while the substrate is a filter paper instead of silica gel. The detection system is encased in molded plastic and, like Danchek®, can also be inserted into a film can, exposed to the air inside the can, and easily viewed from the outside.
The objective of this study was two-fold: to test the two commercially available indicators, Film Decay Detector® “FDD” and Danchek®, and to study various indicators to determine if a sensitive, semi-quantitative and short-term test could be designed. A simple and easy test could approximate the acidity level of the film and be a substitute for an acidity-titration measurement that is used in research studies. The free acidity-titration procedure is not a commonly used test among archivists and conservators since it requires a chemical laboratory and is destructive.
The following materials and supplies were used in the experiments described below:
The color change of the commercial indicators and “home-made indicator papers were observed and recorded with a Colorimeter-X-rite® 938 Spectrodensitometer, measuring with CIELAB values. All three values “L*, a* and b*” were measured with a colorimeter. The L* and b* values were used in evaluating the shift of the indicators since there was a change in lightness and in the blue-to-yellow color range.
The commercial sensors were tested for their ability to detect different acidity levels in film. Four 50′ rolls of motion picture film were incubated “90°C/50% RH” to achieve free acidity levels7 of 0.1, 0.2, 0.4 and 0.7 and then re-conditioned at 50% RH. “IPI has suggested that a free acidity value of 0.5 is the “autocatalytic” point where serious “vinegar syndrome” deterioration, acetic acid production, begins to occur.” One 50′ roll was conditioned at 50% RH and used as a fresh film sample “0.02 free acidity”. The two indicators were inserted into the appropriate 35mm motion picture film cans with the differing acidity levels. The film cans were sealed with tape.
It was observed that the 0.4 and 0.7 samples shifted the FDD® indicator towards yellow within two hours. The Danchek® indicator also shifted, but at a much slower rate; about 1/4 of the silica gel had turned yellow in two hours. After 24 hours, the color shift for both products was complete. Generally, anything above 0.4 showed significant visual change while samples below an acidity level of 0.2 did not shift towards a yellow color. The amount of acid which was given off at these low levels was not enough to the reach the pH at which the color change occurs.
These preliminary results indicate that these products can accomplish what they claim, that at a specific acetic acid level the sensor can shift from green to yellow. The results are also significant since 0.4 is a level at which acid starts to show autocatalysis. Laboratory studies at the Image Permanence Institute show that the reaction is autocatalytic at 0.5 acidity level. “A note of caution: only acetate was tested, even though the manufacturers of FDD claim that their product works for nitrate film. Since nitric acid is a stronger acid “lower pH” than acetic acid, the indicator may not produce the same results as with acetate film.”
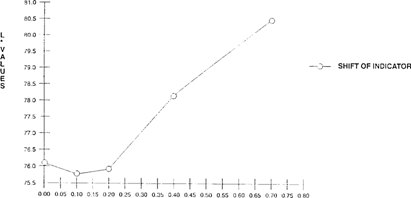
A Colorimeter-X-rite® 938 Spectrodensitometer, measuring with CIELAB values “L*, a* and b*” was used to quantify the shift of the FDD indicator. As the acidity levels rose, there was a corresponding increase of both L* values “lightness” and b* values “shift from green to yellow”. “See Figures 1 & 2” Visual observation corresponded with the quantitative results.

FIGURE 1: Effect of Acidity on Light Value Change of FDD Indicator “Indicator in 100”x 35 mm metal can with 50′ film for 5 days”
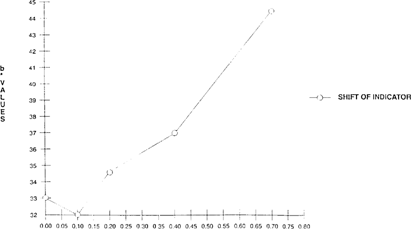
FIGURE 2: Effect of Acidity on Color Change of FDD Indicator “Indicator in 100”x 35 mm metal can with 50′ film for 5 days”
A 50′ roll of film was incubated “90°C/50% RH” until it reached an acidity level of 2.0. Half of the roll was placed in an untaped can and the other half in a microfilm box “also conditioned at 50% RH”. One box was prepared with no film. A set of containers was prepared for each indicator. The color shift was observed and recorded.
The commercial indicators shifted more quickly in the film cans than the microfilm box. The complete shift in the microfilm box was 3 1/2 hours for both indicators while the change in the film can took 50 minutes. This indicates that the acetic acid may be absorbed into the cardboard microfilm box thus lowering the acidity level of the atmosphere within the container. Since a container is a factor, sufficient time must be given before noting any color change and determining if the acetate-based film is generating any acetic acid.
The following indicators were chosen because of their ability to detect weak acids at the pH range of about 4–6. Indicator solutions were made which were based on the formulas listed in The Merck Index “11th edition”:
* Bromothymol blue: “pH 6.0 yellow, pH 7.6 blue” Dissolved 0.1 g in 100 ml of 50% anhydrous alcohol.
* Chlorophenol red: “pH 5.2 yellow, pH 6.8 red” Dissolved 0.1g in 23.6 ml 0.01M NaOH + 226.4 ml of water.
* m-Cresol purple: “pH 5.2 yellow, pH 6.8 purple” Dissolved 0.1 g in 26.2 ml of 0.01M NaOH and 223.8 ml water.
* Methyl red: “pH 4.4 red, pH 6.2 yellow” Solution prepared as 0.1% in methanol.
* Bromcresol green: “pH 3.8 yellow, pH 5.4 blue-green” Dissolved 0.1 g in 250 ml of anhydrous alcohol.
The indicators, formulated as listed above, were applied to Whatman® #1 filter paper. The prepared indicator papers were placed in film cans with incubated film at 0.1, 0.2, 0.4, 0.7 acidity levels and fresh film, 0.02, as a control. For each indicator, the color shift as measured by the colorimeter was observed and recorded.
Of the five indicators tested, bromcresol green gave the most satisfactory results. “See Figures 3 & 4” The other four indicators, bromothymol blue, m-cresol purple, methyl red and chlorophenol red changed at an inappropriate pH. The color shift of these indicators could not be easily distinguished and they also shifted in the fresh film can. The color change pH range of the other indicators were closer to neutral “pH 7” than bromcresol green. Therefore, lower concentrations of acid easily shifted the color of these indicators, even in the fresh film can. Methyl red which has a lower pH range than the other three indicators had potential as an indicator paper but the shifting of the color in the fresh film can took one week instead of a day.
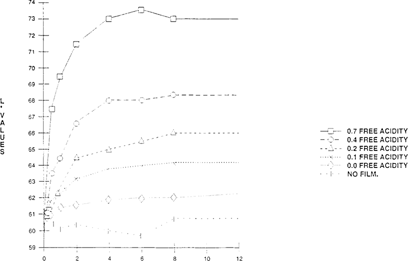
FIGURE 3: Change of Lightness Value of Bromcresol Green Indicator with Time
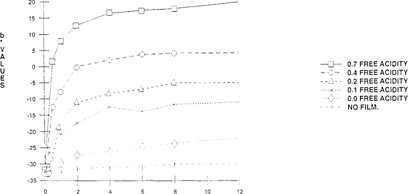
FIGURE 4: Change of Color of Bromcresol Green Indicator with Time
As seen in Figures 3 & 4, there is an initial color shift within the first four hours which levels out immediately. This demonstrates that these “home-made” indicators can only be used as short-term tests. A further study was made which compared a 24-hour exposure and five-day exposure at the same acidity levels. No significant change of color or lightness was observed in the five-day exposure over the 24-hour exposure. The color change was consistent between 24 hours and five days. “See Figures 5 & 6.”
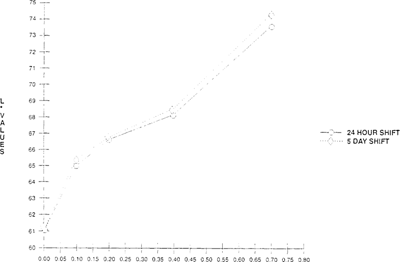
FIGURE 5: Effect of Film Acidity on Light Value Change of Bromcresol Green Indicator “Indicator in 100”× 35 mm metal can with 50′ film”
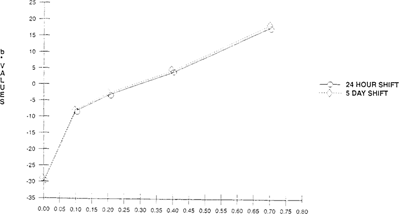
FIGURE 6: Effect of Film Acidity on Color Change of Bromcresol Green Indicator “Indicator in 100”× 35 mm metal can with 50′ film”
For bromcresol green, The Merck Index lists two procedures for preparation of these indicators. One formula which uses water is prepared for use as pH indicator. The other solvent, alcohol, prepares the indicator for volumetric work. Comparisons between the different solutions were made. The alcohol-based indicator had greater color saturation when applied to the substrate. Testing at different acidities indicated that the alcohol-based indicator exhibited a greater color shift “increase in b* values” which was easier to distinguish. The lightness “L*” shift showed no significant difference between the two solvents. “See Figures 7 & 8.”
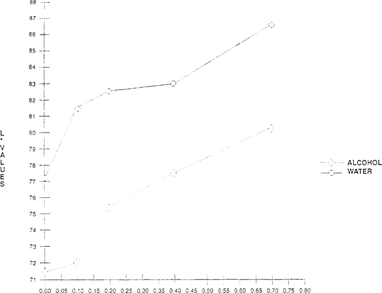
FIGURE 7: Effect of Solvent on Lightness Sensitivity of Bromcresol Green Indicator
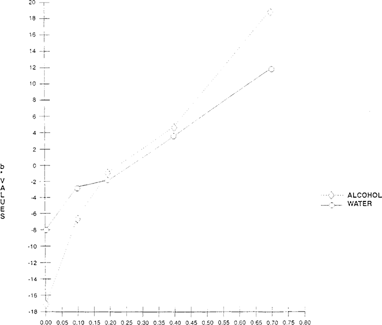
FIGURE 8: Effect of Solvent on Color on Lightness Sensitivity of Bromcresol Green Indicator
In addition, the pH of the various indicators was increased with 0.1N NaOH to a pH of 12 in order to make the indicator papers more “sensitive”. The addition of the base actually increases the amount of acid necessary to reach the pH at which the color change will occur. In the case of bromcresol green this was advantageous since it increased the color change pH range. Accordingly, the bromcresol green indicator paper provided a greater visual change from blue to green to yellow instead of green to yellow “See Figures 9.”
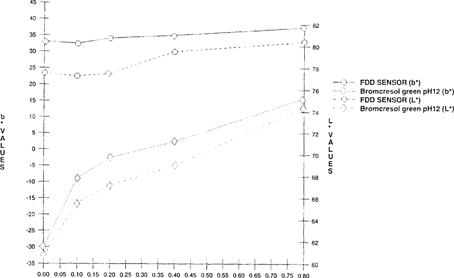
FIGURE 9: Effect of pH on the Sensitivity of Bromcresol Green Indicator “5 days”
In Experiment #3 it was determined that bromcresol green on filter paper gave satisfactory results in detecting acetic acid in 35mm film cans. Other substrates needed to be tested in order to determine if they would either increase or decrease the sensitivity of the indicator. Indicators were prepared as above and applied to various papers, such as Whatman glass micro fiber filter paper and Whatman® SG81 paper “a chromatographic paper which combines cellulose and large pore silica gel”.
Comparisons were made between Whatman® filter paper and Whatman® SG81 using a Colorimeter-X-rite® 938 Spectrodensitometer, measuring with CIELAB values “L*, a* and b*”. Both papers were placed together in 35mm motion picture film cans at with ranging acidity levels “0.04 to 0.7”. A slightly greater shift was observed for the SG81 paper versus the filter paper for both color “b*” and lightness “L*”. The greater shift observed in the SG81 paper was not significant enough to change use of the substrate, since this paper is much more costly than Whatman #1. “See Figures 10 & 11”.
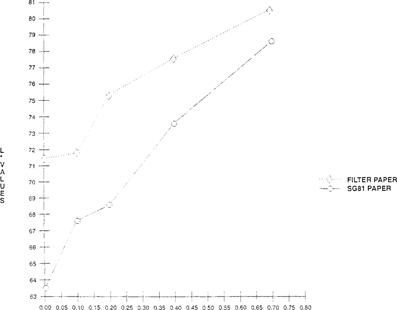
FIGURE 10: Effect of Substrate on Lightness Sensitivity of Bromcresol Green Indicator
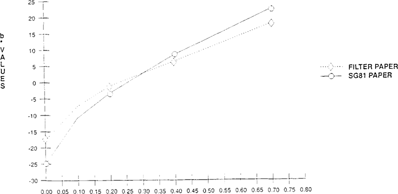
FIGURE 11: Effect of Substrate on Color Sensitivity of Bromcresol Green Indicator
Another substrate tested was Whatman® glass micro fiber filter paper. The basicity of this paper was too great. “N.B. This is essentially the same effect as adding 0.1 NaOH to the indicator.” In fact, it made the indicator less “sensitive” and did not allow the indicator to shift in the presence of acetic acid. Whatman® filter paper became the substrate of choice.
Preliminary results show that the “home-made” indicator shifts at a slower rate at 20% than at 50% RH. “See Figures 12 & 13.” In addition, smaller changes were evident at 20% RH for both color and lightness than at 50% RH. Since the indicator color change reactions require moisture, they work more efficiently in an aqueous environment and at a higher relative humidity.
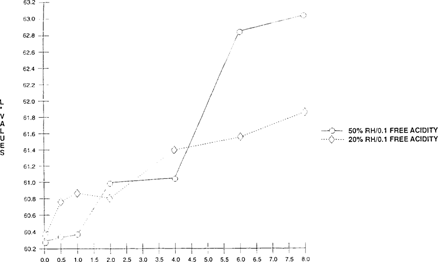
FIGURE 12: Effect of Relative Humidity on Lightness Sensitivity of Bromcresol Green Indicator “Two 100” × 35 mm metal cans with 50′ film – one conditioned at 50% RH and the other at 20% RH”
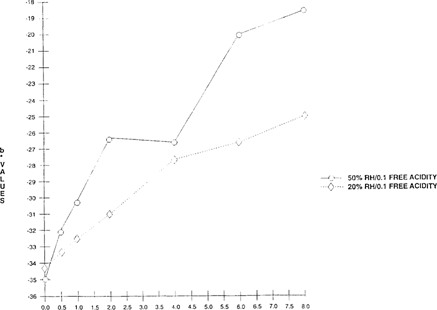
FIGURE 13: Effect of Relative Humidity on Color Sensitivity of Bromcresol Green Indicator “Two 100” × 35 mm metal cans with 50′ film – one conditioned at 50% RH and the other at 20% RH”
To study the effect of relative humidity on the indicator papers, 100′ rolls were incubated at 90°C/50% RH until they reached the free-acidity levels of 0.1, 0.2 and 0.4. Two rolls were obtained at each acidity level. One was subsequently conditioned to 20% and the other to 50%.
The buttons and “home-made” indicators papers were inserted into the cans which contained the conditioned film. Fresh film “0.02 FA” and fresh film “0.02 FA” in the dark, conditioned at the same relative humidities, were used as controls. The change of the buttons were observed over a short period of time.
The Danchek® indicators placed in the cans with film conditioned at 20% RH showed a much slower shift within the first 24 hours of observation. After 24 hours the color shift was complete for the 0.4 free acidity “50% RH” sample. Only 1/2 of the silica gel for the Danchek® 0.4 free acidity sample at 20% had shifted. The color shifts of the FDD® indicator at different RH values was more difficult to distinguish but a significant difference was observed between the fresh film and 0.1 free acidity samples.
After five days the color shift for both the FDD® and Danchek® monitors was complete. The monitors in metal cans with film conditioned to 20% exhibited the same color as those films conditioned at 50%. This investigation indicates that relative humidity affects the shift of the monitors.
The shift of the “home-made” indicators was also slower at 20% RH than at 50% RH, for all the different acidity levels. The 0.4 free acidity sample conditioned at 50% shifted from blue to green-yellow within four hours while the same sample conditioned at 20% took 24 hours to complete the same shift. The lower the free acidity level, the greater the lag time between 20% and 50%. The controls did not shift over the same period of time; they remained blue.
Since relative humidity is a factor, sufficient time of 24–72 hours must be given before noting any color change. This amount of time will allow the indicators to shift completely. The results of the color shift will then be associated with the deterioration of cellulose acetate-based film for both the commercial indicators and “home-made” indicator papers.
Indicators are organic dyes. When they are exposed to the open air they may exhibit pH related changes due to the absorption of CO2 and H2O “H2CO3”. Exposure to light may result in fading which is not a pH related change, displaying results not associated with the detection of acetic acid.
In order to study the effect of the environment further the commercial indicators and the “home-made” indicator papers were placed in an Atlas® Ci65 Weatherometer and exposed to 50 klux xenon for 8 hours. Control buttons which were kept in the dark for the same length of time were compared to those exposed to the xenon light. The color change was observed and recorded with a Colorimeter-X-rite® 938 Spectrodensitometer, measuring with L*, a* and b* values.
A significant visual difference was observed for both the FDD® and Danchek®. When measured with the colorimeter “see Figures 14 & 15”, the FDD® had lightened considerably “increase in L* values” while color “b* values” change was minimal. Danchek® had a greater change in color “increase in b* values” while light fading “L* values” exhibited minimal change.
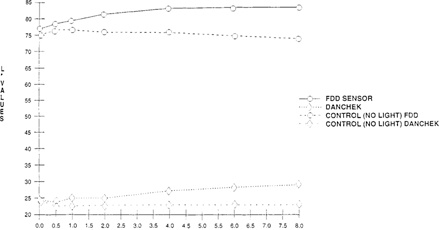
FIGURE 14: Effect of Light on Lightness Sensitivity of Commercial Indicators “High intensity daylight 50 klux – xenon for 8 hours”
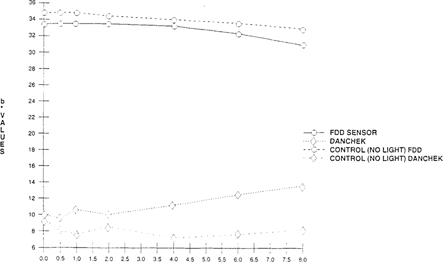
FIGURE 15: Effect of Light on Color Sensitivity of Commercial Indicators “High intensity daylight 50 klux – xenon for 8 hours”
The shift of the indicator papers for both value and hue was significant when compared to the control. The sample had shifted from a dark blue to a light yellow. “See Figures 16 & 17.” Since the indicator dye fades in the presence of light, the indicator papers could be placed inside the film can instead of outside, and kept from light when not in use.
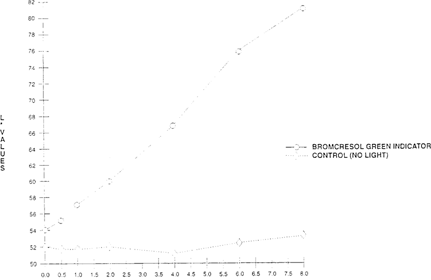
FIGURE 16: Effect of Light On Lightness Sensitivity of Bromcresol Green Indicator Paper “High intensity daylight 50 klux – xenon for 8 hours”
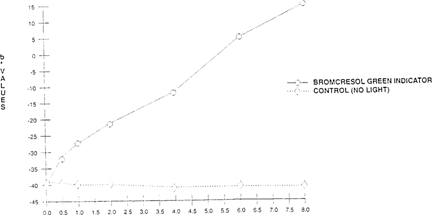
FIGURE 17: Effect of Light On Color Sensitivity of Bromcresol Green Indicator Paper “High intensity daylight 50 klux – xenon for 8 hours”
It has been known for a long time that indicators can be used to determine an approximate level of acidity. Acid-base indicators do seem to offer a way of quickly determining an approximate acidity level of the film. However, inherent problems with all indicators may limit the use of these products. All acid-base indicators, including the two commercial indicators tested in this study are sensitive to atmospheric pollutants, light and relative humidity. This may produce false results if the product is not used for its intended purpose. A possible solution is to protect the indicators in the dark until use.
Of the various “home-made” indicators studied, bromcresol green on filter paper gave the most promising results. The addition of base increased its ease of use since color change was easier to distinguish “blue to green to yellow instead of green to yellow”. Therefore, it may be a more reliable “short-term” monitor when determining an approximate acidity level. The factors of atmospheric pollutants, light, and relative humidity also affect it.
Since acid-base indicators could be used as tools in measuring acidity levels, further development is needed to make them a viable option in detecting acetic acids in film collections. Issues such as shelf life before use, packaging, and the effects of relative humidity and temperature on the ability to detect acidity should be explored further.
This work was in part supported by the National Film Board of Canada, National Archives of Canada and the Canadian Council for Archives.
The authors wish to thank: Dr. Peter Adelstein, Douglas Nishimura, Edward Zinn, Cathy Erbland, Hank Cupriks, Jean-Louis Birgourdan, Karen Santoro and Jane Pestke. We also thank Professor Glen Miller of the Rochester Institute of Technology for allowing the use of his Colorimeter-X-rite® 938 Spectrodensitometer.
1) Grzywacz, C., & Dusan C. Stulik 1991. Passive monitors for the detection of pollutants in museum environments. Paper at the Objects Specialty Group at the Annual Meeting of the American Institute for Conservation: Albuquerque, NM.
2) Grzywacz, C. 1993. Using Passive Sampling Devices to Detect Pollutants in Museum Environments. ICOM preprints, 10th Triennial Meeting, ICOM Committee for Conservation, Washington, D.C., pp. 610–615.
3) Swider, J 1990. Indicator Project. Unpublished typescript, Rochester, NY: Image Permanence Institute.
4) Both monitors turned blue when a basic solution was applied to the surface. Bromcresol green is blue when in basic solution and shifts from green to yellow in an acidic solution.
5) The Merck Index (11th edition). 1989. Rahway, NJ: Merck & CO., INC.
6) CRC Handbook of Chemistry and Physics (72nd edition). 1991. Boca Raton: CRC Press.
7) The acidity-titration measurement to determine acidity levels of acetate film was taken from the specifications of ANSI IT9-1 with the following exception: 1.0g of acetate film is placed in 100 ml of water at 38°C for a 24 hour period, in order to leach out the acetic acid. The solution is then titrated in with 0.1N NaOH, using m-cresol purple as the indicator.
The ANSI IT9-1 (1992) p. 3 standard states “the cellulose-ester base shall not have a free acidity greater than the equivalent of 0.5 ml of 0.1M sodium hydroxide solution per gram of film. The units for free acidity are milliliters per gram.
1. Danchek®
Farusa Works A/S
3520 Farum
DENMARK
2. Film Decay Detector®
Bramekamp Technic Trade GMBH
Korte Bloeck 52
D-22397
Hamburg 65
GERMANY
3. Whatman® Filter Paper
9 Bridewell Pl.
Clifton, NJ 07014
“201”-773-5800
4. Indicators
VWR Scientific
P.O. Box 1050
Rochester, NY 14603
“716”-247-0610
5. 35mm color-motion picture print film on triacetate base
Eastman Kodak® Company
Rochester, NY 14650
1-800-242-2424
6. Colorimeter-X-rite® 938 Spectrodensitometer
X-rite
3100 44th Street, S.W.
Grandville, MI 49418
“616”-534-7663
7. Atlas® Ci65 Weatherometer
Atlas Electric Devices Company
4114 North Ravenwoods Ave.
Chicago, IL 60613
“312”-327-4520
Monique C. Fischer is a Getty Fellow in photograph conservation at the Northeast Document Conservation Center. She previously interned at the Image Permanence Institute at Rochester Institute of Technology in Rochester, New York, and The International Museum of Photography at the George Eastman House. She holds a master's degree in art conservation from the University of Delaware/Winterthur Museum, and a bachelor's degree in chemistry from Smith College, Northampton, MA. Address: Northeast Document Conservation Center, 100 Brickstone Square, Andover, MA, 01810.
James M. Reilly holds a master's degree from the State University of New York at Buffalo. He is the Director of The Image Permanence Institute at Rochester Institute of Technology in Rochester, New York. The Image Permanence Institute is an academic research lab with a staff of nine persons dedicated to image preservation and education of preservation professionals. It is co-sponsored by the Society for Imaging Science and Technology. Mr Reilly is the author of numerous technical articles on photograph preservation. He has written two books, most recently Care and Identification of 19th Century Photographic Prints, published by Kodak in 1986. Address: Image Permanence Institute, Rochester Institute of Technology, Frank E. Gannett Memorial Building, P.O. Box 9887, Rochester, NY, 14623.